
User`s guide

Gyro Control Unit (GCU)
User’s Guide
24
MaxMetrix, Scottsdale, AZ
PN: GCU-2K1-UG:RevI.2 NGC
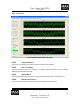
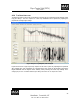
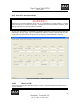
Figure 20 Spectrum Analyzer with 800Hz notch filter turned ON
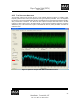
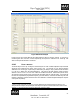
4.1.3.1 DATA SELECT
The Data Select radio buttons allow the user to select the input source to the Spectrum Analyzer. The
spectrum analyzer first applies a window function (i.e., Hanning Window) to the input data stream and then
calculates a 32768 point FFT. The resultant power spectral density estimation (PSDE) is then calculated by
taking the magnitude of the FFT complex data set and plotting it in the display.
4.1.3.2 AUTO-Y
Checking the Auto-Y selection for either the time domain or the frequency domain will automatically scale
the data range in the associated graph.
4.1.3.3 PSDE
The magnitude of the power spectral density estimation can be displayed on either linear or logarithmic
scale.
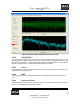
4.1.3.4 PEAK HOLD ENABLE
The peak hold enable plots the peaks of the PSDE output. Un-checking the option clears the Peak Hold
graph. (i.e., the Magenta Plot in the spectrum window).