
User manual
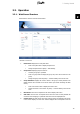

3.2.2. Group View
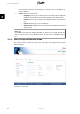
Click on the group name to display the group view. In group view, a list of all inverters in the
current group is displayed, detailing:
• overall status (see
Operation
)
• real time production level
• total power output
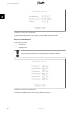
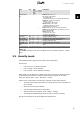
In group view, the following graphs are generated based on data from the current group:
Production graph
Interval Unit Description
Daily kWh Energy production for the current day.
Monthly kWh Energy production on a daily basis for the current month to date.
Yearly kWh Energy production on a monthly basis for the current year to date.
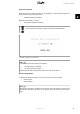
Performance graph - PR (with irradiation sensor installed)
Interval Unit Description
Monthly % Performance ratio in [%] for the current month to date.
Yearly % Performance ratio in [%] for the current year to date.
Performance graph - yield (with no irradiation sensor installed)
Interval Unit Description
Monthly hours Operating time for month to date.
Yearly hours Operating time for the year to date.
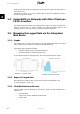
3.2.3. Inverter View
Click on the inverter name to display the inverter view. In inverter view, the following graphs
are generated based on inverter data:
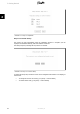
Production graph
Interval Unit Description
Daily W
VA
VAr
W
Active power
Apparent power
Reactive power
PV power
Monthly kWh Energy production on a daily basis, month to date.
Yearly kWh Energy production on a monthly basis, year to date.
Performance graph - PR (with irradiation sensor installed)
Interval Unit Description
Monthly % Performance ratio in [%] for the current month to date.
Yearly % Performance ratio in [%] for the current year to date.
Performance graph - yield (with no irradiation sensor installed)
Interval Unit Description
Monthly hours Operating time for month to date
Yearly hours Operating time for the year to date.
3. View
L00410583-01_02 19
3