
User's Manual
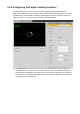
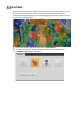
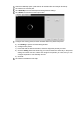

Table Of Contents

Heat Map
A heat map is a representation of people flow data in the form of a map or diagram in which
data values are represented as colors. The heat map example below shows a retail
environment, with red indicating areas of increased people flow and blue areas representing
areas of decreased people flow.
Log into the camera’s web interface and select the SETTING tab.
Click Event menu item, at the left side of the screen. Then, click SMART PLAN.
The SMART PLAN interface is displayed.