
User's Manual


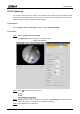

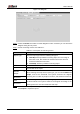


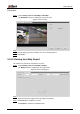
Table Of Contents
- Foreword
- Important Safeguards and Warnings
- 1 Overview
- 2 Configuration Flow
- 3 Device Initialization
- 4 Basic Configuration
- 4.1 Login
- 4.2 Live
- 4.3 PTZ Operation
- 4.4 Playback
- 4.5 Camera
- 4.5.1 Conditions
- 4.5.2 Setting Video Parameters
- 4.5.2.1 Video
- 4.5.2.2 Snapshot
- 4.5.2.3 Overlay
- 4.5.2.3.1 Configuring Privacy Masking
- 4.5.2.3.2 Configuring Channel Title
- 4.5.2.3.3 Configuring Time Title
- 4.5.2.3.4 Configure Text Overlay
- 4.5.2.3.5 Configure Font Attribute
- 4.5.2.3.6 Configure Picture Overlay
- 4.5.2.3.7 Configure Custom Overlay
- 4.5.2.3.8 Configuring OSD Info
- 4.5.2.3.9 Configuring Counting
- 4.5.2.3.10 Configuring Structured Statistics
- 4.5.2.3.11 Configuring Ranging
- 4.5.2.3.12 Configuring ANPR
- 4.5.2.3.13 Configuring Face Statistics
- 4.5.2.4 ROI
- 4.5.2.5 Path
- 4.5.3 Audio
- 4.6 Network
- 4.7 Storage
- 4.8 System
- 5 Event
- 5.1 Setting Alarm Linkage
- 5.2 Setting Smart Track
- 5.3 Setting Panoramic Calibration
- 5.4 Setting Video Detection
- 5.5 Setting Smart Motion Detection
- 5.6 Setting Audio Detection
- 5.7 Setting Smart Plan
- 5.8 Setting IVS
- 5.9 Setting Crowd Map
- 5.10 Setting Face Recognition
- 5.11 Setting Face Detection
- 5.12 Setting People Counting
- 5.13 Setting Heat Map
- 5.14 Setting Stereo Analysis
- 5.15 Setting ANPR
- 5.16 Setting Video Structuralization
- 5.17 Setting Relay-in
- 5.18 Setting Abnormality
- 6 Maintenance
- Appendix 1 Cybersecurity Recommendations

User’s Manual
170
Parameter
Description
Statistics Type
The statistical type of people counting report.
When you select Number of people, the system generates the report
of the number of people that exceeds the configured number of
people.
When you select Average stranding time, the system generates the
report of the average stranding time that exceeds the average
stranding time.
Time Range
Select the period for the report.
When selecting People Counting, you can view daily report, monthly
report and annual report.
When selecting In Area No., you can view daily report and monthly
report.
Begin Time
The begin time and the end time of people counting.
End Time
People
Counting
Direction
In and out directions of people counting report. You can select Entrance
or Leave. Select Display Data, and the statistical quantity is displayed on
the report.
Stranding Time
Count the stay time, select 5 s, 30 s, or 60 s.
Queue Time
Count the queuing tine, select 1 minute, 5 minutes, or 10 minutes.
Report Type
(Bar Chart/Line
Chart)
Includes bar chart and line chart.
Rule 1, Rule
2…
Select the check box to search the report of the corresponding rule.
Click Search to complete the report. Step 3
Click Export to export the report in .bmp or .csv format.
Setting Heat Map 5.13
Make statistics on the cumulative density of object movement and view heat map in report.
5.13.1 Heat Map
Detect the distribution of dynamically moving objects in the target area within a certain period
and displays the distribution on a heat map. Color varies from blue to red. The lowest heating
value is in blue, and the highest heating value is in red.
When mirroring occurs on the camera or the viewing angle changes, original data on the heat
map will be cleared.
Preparation
Select Setting > Event > Smart Plan, and then enable Heat Map.