
User's Manual


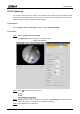

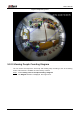
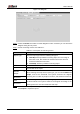


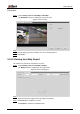
Table Of Contents
- Foreword
- Important Safeguards and Warnings
- 1 Overview
- 2 Configuration Flow
- 3 Device Initialization
- 4 Basic Configuration
- 4.1 Login
- 4.2 Live
- 4.3 PTZ Operation
- 4.4 Playback
- 4.5 Camera
- 4.5.1 Conditions
- 4.5.2 Setting Video Parameters
- 4.5.2.1 Video
- 4.5.2.2 Snapshot
- 4.5.2.3 Overlay
- 4.5.2.3.1 Configuring Privacy Masking
- 4.5.2.3.2 Configuring Channel Title
- 4.5.2.3.3 Configuring Time Title
- 4.5.2.3.4 Configure Text Overlay
- 4.5.2.3.5 Configure Font Attribute
- 4.5.2.3.6 Configure Picture Overlay
- 4.5.2.3.7 Configure Custom Overlay
- 4.5.2.3.8 Configuring OSD Info
- 4.5.2.3.9 Configuring Counting
- 4.5.2.3.10 Configuring Structured Statistics
- 4.5.2.3.11 Configuring Ranging
- 4.5.2.3.12 Configuring ANPR
- 4.5.2.3.13 Configuring Face Statistics
- 4.5.2.4 ROI
- 4.5.2.5 Path
- 4.5.3 Audio
- 4.6 Network
- 4.7 Storage
- 4.8 System
- 5 Event
- 5.1 Setting Alarm Linkage
- 5.2 Setting Smart Track
- 5.3 Setting Panoramic Calibration
- 5.4 Setting Video Detection
- 5.5 Setting Smart Motion Detection
- 5.6 Setting Audio Detection
- 5.7 Setting Smart Plan
- 5.8 Setting IVS
- 5.9 Setting Crowd Map
- 5.10 Setting Face Recognition
- 5.11 Setting Face Detection
- 5.12 Setting People Counting
- 5.13 Setting Heat Map
- 5.14 Setting Stereo Analysis
- 5.15 Setting ANPR
- 5.16 Setting Video Structuralization
- 5.17 Setting Relay-in
- 5.18 Setting Abnormality
- 6 Maintenance
- Appendix 1 Cybersecurity Recommendations

User’s Manual
168
Diagram Figure 5-57
Select the Enable check box to enable diagram function. And then you can search the Step 2
diagram during the set period.
Set the searching criteria. See Table 5-17. Step 3
Table 5-17 Description of searching criteria
Parameter
Description
Report Type
Select the report type from the following two types:
Heat Map: Density statistics of moving object, the color range is
from blue to red, blue means the minimum heat value and red
means the maximum heat value.
Track Map: Tendency statistics of moving object.
Start Time
The start time of the report.
End Time
The end time of the report.
Number of
People
When selecting heat map as the report type, you can select Number of
People, and set the threshold. The system searches the diagram
according to the number of people in the area, and shows the heat map.
Threshold
Time
When selecting heat map as the report type, you can select Time, and
set the threshold. The system searches the diagram according to the
queuing time in the area and shows the heat map..
Threshold
Click Search to complete the diagram. See Figure 5-58. Step 4
Click Export to export the report.