
User`s guide


134 Chapter 6 Monitoring XStack Storage
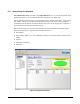
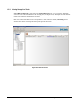
6.2.1 Viewing Storage Pool Information
When Blade A Base Pool is selected in the Logical Resources tab, you can use the Storage Group
Information screen to view information about the storage pool (see
Figure 6-9).
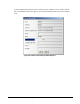
The top-left side of the screen shows the storage pool type, amount of free space, total capacity,
and number of drives. To the right of this information is a pie chart that provides a graphical
representation of the amount of used and unused (free) space in the storage pool. Used space is
shown in gray and unused space is shown in green.
Below this information are rows that correspond to the drives attached to the XStack Storage.
Each row corresponds to a separate drive and shows the drive’s:
Slot number
State (online, offline, etc.). For readability, the state is color coded (green = online, black =
offline.
Capacity
Utilization percentage
Allocation
Figure 6-9. Storage Group Information