
User`s guide


124 Chapter 6 Monitoring XStack Storage
6.1 XStack Storage Screens
When the top XStack Storage icon is selected in the Physical Resources tab, the main display area
can show the following screens with information about:
The XStack Storage enclosure. Refer to Section 6.1.1.
Log messages. Refer to Section 6.1.2.
Tasks information. Refer to Section 6.1.3.
CIM Server information. Refer to Section 6.1.4.
Firmware image information. Refer to Section 6.1.5.
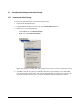
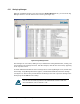
6.1.1 Viewing Enclosure Information
When the top XStack Storage icon is selected in the Physical Resources tab, you can use the
Enclosure Information screen to view information about the XStack Storage enclosure (see
Figure
6-1).
This screen is divided into three areas:
Message Log Summary. The Message Log Summary summarizes the current error, warning,
and information messages in the event log. To enhance visibility, the three message types are
color coded.
– Error messages are red and indicate something unexpected has occurred that may be a
serious problem.
– Warning messages are yellow. Warning messages indicate that something appeared wrong
but has been corrected. They also provide notification about things that may be expected
but are of particular interest.
– Informational messages are green. Informational messages contain information about steps
performed, detected version information, and miscellaneous messages.
For more information about a message, go to the Log Messages screen (refer to Section
6.1.2).
System Settings. The Systems Settings show the spare count, disk line mode, and default BT
priority settings.
TCP/IP Default Parameters. The TCP/IP Default Parameters show the maximum IP
segmentation, TCP window scale, TCP timestamp, and PMTU enabled settings.