
User`s guide


XStack Storage User’s Guide 123
Chapter 6 Monitoring the XStack Storage
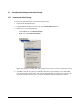
The XStack Storage management console can display a number of screens in the main area for
viewing system and storage information. This chapter shows and describes the screens. Some
screens are available from either the Logical Resources or Physical Resources tab. Other screens
are available from both tabs.
XStack Storage Screens (Physical Resources tabs)
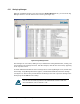
– Viewing enclosure information — refer to Section
6.1.1.
– Viewing log messages — refer to Section
6.1.2.
– Viewing information about tasks — refer to Section
6.1.3.
– Viewing CIM server information — refer to Section
6.1.4.
– Viewing firmware image information — refer to Section
6.1.5.
Blade A Base Pool Screens (Logical Resources tab)
– Viewing information about the storage pool — refer to Section
6.2.1.
– Viewing information about tasks — refer to Section
6.2.2.
– Viewing information about volumes — refer to Section
6.2.3.
– Viewing information about drives — refer to Section
6.2.4.
Network Entities Screens (Logical Resources tab)
– Viewing information about iSCSI target nodes — refer to Section
6.3.1.
– Viewing volume access information — refer to Section
6.3.2.
– Viewing iSCSI initiator access information — refer to Section
6.3.3.
– Viewing information about LAG ports — refer to Section
6.3.4.
– Viewing information about network portals — refer to Section
6.3.5.
– Viewing information about an iSCSI connection — refer to Section
6.3.6.
Initiator Resource Screens (Logical Resources tab)
– Viewing information about iSCSI initiators — refer to Section
6.4.1.
– Viewing LUN access information — refer to Section
6.4.2.
Drive Screens (Physical Resources tab)
– Viewing information about drives — refer to Section
6.2.4.
Ethernet Port Screens (Physical Resources tab)
– Viewing information about Ethernet ports — refer to Section
6.5.