
User's Guide

Chapter 3. Using Your APS3
3.17
Configuring the Display
You can change the way particle measurements are displayed by selecting which particle size
bin to graph, by choosing to display either particle density or particle frequency, by changing
the vertical and horizontal scales, by changing the averaging interval, and other elements in the
display.
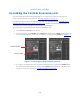
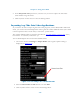
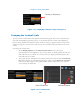
Selecting the Particle Size to Graph
You can choose which of the cumulative particle measurement bins to graph.
To choose which particle bin to graph:
• In the Graph Options, choose the particle size from the Particle Sizes list drop
down menu (see Figure 3.16).
Figure 3.16: Selecting the Particle Size for the Graph
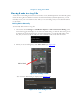
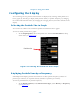
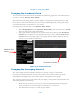
Displaying Particle Density or Frequency
ParticleSpectrum displays particle measurements as either particle frequency (number of
particles per unit time) or as particle density (number of particles per volume).
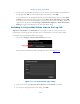
To choose particle density or particle frequency:
• In the Display Options, under Measurement Type, select Density or Frequency
(see Figure 3.17).
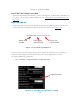
Particle size