
Operation Manual


11
AudioDirecto r Workspace
view is a visual representation of both the time and the audio intensity (or loudness,
measured in decibels) of the audio in each channel.
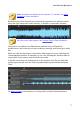
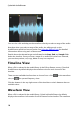
Spectral Frequency View
The spectral frequency view is a graphical representation of the audio in each
channel, and is ideal when using the Visual Repair feature. The colored graph you
see in this view is a three dimensional illustration of the audio attributes in the
selected media file.
The graph shows playback time along the top, and the frequency (relative pitch) of
the audio (measured in hertz) along the right. The colors on the graph indicate the
amplitude or strength of the audio at the point in time. The lighter the color, the
louder the audio is at that frequency and time.