
Technical data

Safety Instructions and Warranty Terms 20
Manual econ sens+ Version 1.40
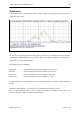
Graph menu
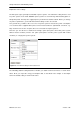
In the Graph menu, the measurement results are represented as a measuring curve. Fig. 22 shows an
example of such a curve.
The sum of the power/energy from the three phases is shown over a certain period of time. Using the
– period and + period buttons next to the X-axis label you can toggle through the measuring curves
step by step (e.g. every day of a month).
The following views are available:
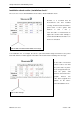
Month view: Consumed and generated energy (kWh) in 15-min steps
Day view: Consumed and generated energy (W) in 15-min steps
Hour view: Consumed and generated energy (W) in 1-min steps
15-min view: Consumed and generated energy (W) in 1-s steps
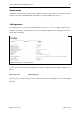
The measured values associated with the curves can be downloaded as a text file using the Download
function
Using File-> Save page as… in your browser you can transfer the text file to your PC.
There are two Download options to choose from; the only difference between them is the use of
different separators (comma or point) in decimal numbers
Figure 14: Measuring curve in Graph menu