
Technical data

Safety Instructions and Warranty Terms 17
Manual econ sens+ Version 1.40
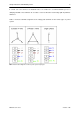
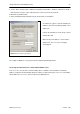
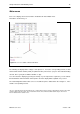
You can also have the voltage and the current on the three phases displayed as a curve by selecting
the Curve option at the bottom left of the screen. (see Fig.18)
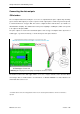
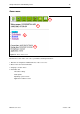
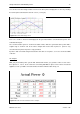
Econ sens+ is able to measure and display both the generated and the consumed active power. This
is illustrated in Fig.12.
The consumed active power is shown in the table in blue, while the generated active power with a
negative sign is shown in red. In the above example this means that on phase L1 power is only
consumed and on phase L2 power is only generated.
If power is both consumed and generated at the same time on one phase, econ sens+ shows the sum
of the two.
An example:
With your photovoltaic power system with downstream inverter you generate 1 kW on each of the
three phases L1, L2, L3, at the same time consuming 500 Watt on phase L2 for various household
appliances. Then your table of measured values would look like the table in Fig. 19.
Figure 19: Table of measured values for the example
Figure 18: Current and voltage curves