
User's Manual


CubiSens
TM
TS100 User Manual
v1.7
© 2020 CubeWorks. All rights reserved. Page 13 / 15
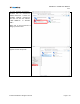
5. Viewing Measured Data Real-Time
Any measurement data from the TS100 received by the Gateway will be displayed in real-time on the GUI
log as part of the “Check-in” message, and also as a datapoint in the “Plot” tab of the GUI, as shown in
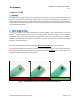
Figure 9. The plot may be used to examine measurement data. User can click on the plot to control it.
After clicking, zooming can be accomplished with the mouse scroll wheel or Page Up and Page Down
buttons on the keyboard. The arrow keys or the right mouse button can be used to move the graph and
examine areas of interest.
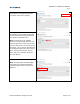
The received data is also saved in CSV format under “My Documents\CubeWorks\” folder with a file name
corresponding to the TS100 device ID. The file location can be configured in the “Settings” tab. The CSV
formatted data file includes the device ID, timestamp, raw data, and converted data.
Figure 9: “Plot” Tab of the GUI Showing Real-time Data from Multiple TS100 Devices