
User`s guide


12
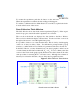
Data Collection: Graph Window
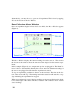
The Graph Window (Figure 8) graphs data from the current experiment using set-
tings from the Table Window. If the experiment is in-progress, the graph is plotted
as data is collected.
Figure 8: Data Collection: Graph Window
Two different lines may be graphed simultaneously. Using the Pointer, you may
select a point on a line and learn its precise coordinates. The points will appear in
the gray, pink and blue boxes at the right of the screen. The y-coordinate in the
pink box correlates with the pink line, and the y-coordinate in the blue box coordi-
nates with the blue line. Only one x-coordinate may be selected at a time.
To quickly scroll through large areas of the graph, use the Pan tool. To scroll
through point-by-point, use the Scroll arrows.
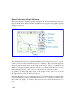
Selecting the Full Screen icon changes the view so that the graph is enlarged. This
is shown in Figure 9. The toolbar floats in this view, so you may move it if it inter-
feres with your graph. To return to the previous view, select the Normal Screen
icon.