DataCollector designed by: Thomas S.
Table of Contents Introduction . . . . . . . . . . . . . . . . . . . . . . . . . . . . . . . . . . . . . . . . . . . . . . . . . . . . . . . . 1 Kit Contents . . . . . . . . . . . . . . . . . . . . . . . . . . . . . . . . . . . . . . . . . . . . . . . . . . . . . . . . 2 Getting Started . . . . . . . . . . . . . . . . . . . . . . . . . . . . . . . . . . . . . . . . . . . . . . . . . . . . . 3 Features of the DataCollector . . . . . . . . . . . . . . . . . . . . . . . . . . . . . . . . . . . . . . . . . . .
Updating the Software . . . . . . . . . . . . . . . . . . . . . . . . . . . . . . . . . . . . . . . . . . . . . . . . . . . 26 Warnings and Precautions . . . . . . . . . . . . . . . . . . . . . . . . . . . . . . . . . . . . . . . . . . . .
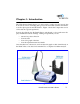
Chapter 1: Introduction The CPO Science DataCollector is a device used to easily view and record data from various sensors, including analog sensors from Fourier Systems and Vernier, as well as photogates from CPO Science. Figure 1 shows the components used to collect data in a typical experiment. Sensors plug directly into the DataCollector, and the unit’s color touch-screen displays instant and accurate readings.
Chapter 2: Kit Contents There are two different configurations of the DataCollector available. These are summarized in the table below.
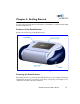
Chapter 3: Getting Started Use the following diagrams and information to familiarize yourself with the CPO Science DataCollector. Features of the DataCollector Figure 2 shows the parts of the DataCollector. Figure 2: DataCollector Parts Powering the DataCollector The DataCollector is powered by the CPO Science 9V power adapter (included). Alternatively, it may be powered by a 9V battery. Using the power adapter is recommended, as battery life may be limited.
Figure 3: DataCollector Port Identification Port Identification The DataCollector has six ports on the rear of the enclosure, shown in Figure 3. The analog ports are labeled Sensor 1 and Sensor 2. Most sensors will connect through these ports. The digital ports are labeled Photogate A and Photogate B, as they are primarily intended for use with CPO Science Photogates. However, the CPO Science Sound & Waves also connect through these ports. Connect to these ports with the supplied phone cords.
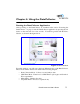
Chapter 4: Using the DataCollector Starting the DataCollector Application After powering on the DataCollector as described in the section “Powering the DataCollector” on page 3, start the DataCollector application by pressing the Go button on the enclosure for a few seconds. You will be greeted with the Home Window, as shown in the figure below. Figure 4: Home Window From this window, you will access the four different modes of the DataCollector.
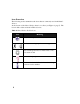
Icon Overview The following section summarizes the icons that are commonly used in the DataCollector. At the bottom of the Home Window there is a toolbar (see Figure 4, page 5). The icons in this toolbar are listed in Table 2, below. Table 2: Home Window Toolbar Icons Icon Meaning Returns to the previous window Indicates a running experiment or a stopped one Sets default preferences for DataCollector. Also sets name of unit.
While conducting an experiment, a status bar is shown at the top of the screen. The status bar contains buttons to easily access the Home and Help Windows. It also displays a variety of indicators which are summarized in Table 3. Table 3: Status Bar Icons Icon Meaning Return to Home Window Indicates an analog sensor is connected to “Sensor 1” port. Black indicates the sensor is used in an active experiment. Gray indicates the sensor is plugged in, but inactive.
Table 3: Status Bar Icons Icon Meaning Indicates a continuous experiment. Data collection continues until user manually stops experiment. See “Rate” on page 16. Indicates the data set is locked. Indicates a digital sensor is connected to “Photogate A” port. Black indicates the sensor is used in an active experiment. Gray indicates the sensor is plugged in, but inactive. Indicates a digital sensor is connected to “Photogate B” port. Black indicates the sensor is used in an active experiment.
Chapter 5: Data Collection Mode Data Collection Mode is used to collect, record and analyze data. After selecting “Data Collection” from the Home Window, you are greeted with the following screen (Figure 5). Figure 5: Data Collection: Go! Window Starting an Experiment The DataCollector is designed so that you can immediately begin a new experiment by simply tapping “Go!”. Starting a new experiment in this manner utilizes the default settings of the DataCollector.
Alternatively, you may choose to open an old experiment. This is done by tapping Files at the bottom of the Go! Window. Data Collection: Meter Window Once an experiment begins in Data Collection Mode, the Meter Window appears (Figure 6). Figure 6: Data Collection: Meter Window The Meter Window displays the current readings for active sensors. The clock at the bottom of the window shows the amount of time elapsed for the current experiment. In this example (Figure 6), two temperature probes are plugged in.
To resume the experiment, push the Go button on the enclosure. When the experiment is resumed, the last readings will disappear. To switch to a different window within Data Collection Mode, tap the desired window tab at the bottom of the screen. Data Collection: Table Window The Table Window shows data in the current experiment (Figure 7). If the experiment is in-progress, data in the table is updated as it’s collected. The row above the header row displays live data, similar to the Meter Window.
Data Collection: Graph Window The Graph Window (Figure 8) graphs data from the current experiment using settings from the Table Window. If the experiment is in-progress, the graph is plotted as data is collected. Figure 8: Data Collection: Graph Window Two different lines may be graphed simultaneously. Using the Pointer, you may select a point on a line and learn its precise coordinates. The points will appear in the gray, pink and blue boxes at the right of the screen.
Figure 9: Data Collection: Graph Window - Full Screen Data Collection: Setup Window In the Setup Window (Figure 10), you will see the settings for the current experiment. Should you wish to restart an experiment using these settings, press “Go!”. If you would like to change the settings before starting a new experiment, press “Modify”.
After selecting “Modify”, you will see the following window. Figure 11: Data Collection: Modify Setup Window From here, you can change the file name, select the experiment mode, change the sampling rate and size, turn sensors on and off, and select units. File name The default file name is Experiment. Without renaming the files, the experiments are numbered sequentially. To rename an experiment, double tap on the current experiment name. This will open a keyboard window in which you can create a new name.
Figure 12: Data Collection: Rename Experiment Window Mode There are two different types of experiments you can run: Interval Mode or Standard Mode experiments. Interval Mode is the default setting. To change modes, tap the down arrow to see the drop-down menu and make a mode selection. Interval Mode experiments use photogates, or other digital sensors, to record time intervals only. Standard Mode experiments record values from digital or analog sensors on a regular basis. Refer to “Interval vs.
Rate The Rate setting controls how often the DataCollector takes measurements in Standard Mode. The DataCollector has rates from 1 - 2,000 Hz. The default rate setting is 1 Hz. Tap the down arrow to see the drop-down menu of sampling rates and make a selection. The sampling rate is indicated in the status bar of Data Collection Mode. If you are operating in Interval Mode, the rate will read “N/A”. Sensor 1 & Sensor 2 The DataCollector automatically detects and identifies sensors when they are plugged in.
Chapter 6: CPO Timer Mode Overview of Functions and Features CPO Timer Mode works like the CPO Timer for photogate and Sound & Wave experiments. The photogate icon in the status bar indicates you are in CPO Timer Mode. There are four different functions in CPO Timer Mode: Interval (I), Frequency (f), Period (p) and Count (#). The function is selected by tapping the desired function button at the bottom of the screen. The current function is noted in the status bar. See Figure 13.
The Reset button, at the bottom of the window, is used to clear all readings, and resets the current value to zero. The Memory button is a feature available only in Interval Function. Pressing Memory shows the previous reading in a black box, to the right of the current reading. The memory reading is toggled on and off by tapping the Memory button. Pressing Reset clears the values stored in the memory. Similar to Memory, the Hold feature is used in Frequency, Period and Count Functions.
Figure 14: Time Intervals and Photogates Frequency Function In CPO Timer Mode, the DataCollector can measure the frequency of anything that breaks the light beams in the photogates regularly, or the frequency of signals applied to the inputs, such as those from the CPO Sound & Waves machine. The highest frequency that can be measured is 19,999 Hz and the lowest is 0.1 Hz. For very low frequencies (<100 Hz) it is more accurate to use the Period Function, measure the period (T), and invert (f = 1/T).
• the frequency of a vibrating string • the RPM of the CPO Science Electric Motor or Ripcord Generator Period Function The Period Function measures the period of signals which are connected to the inputs. The photogates can provide the signals (such as with the Pendulum) or the Sound & Waves experiment can provide the signals. The period is measured in seconds. Period Updates Every Other Cycle You will notice that the period only updates every third time the Pendulum crosses the light beam.
Chapter 7: Meter Mode In Meter Mode, current values for sensors are displayed, as well as the experiment clock. No data is stored. The Meter icon in the status bar indicates that you are in Meter Mode. See Figure 15. The units are populated with default settings that corollate with the sensors. The units can easily be changed. Tap the down arrow to access a drop-down menu of units and make a selection.
Chapter 8: Stopwatch Mode In Stopwatch Mode, the DataCollector functions solely as a stopwatch. The Stopwatch icon in the status bar indicates you are in Stopwatch Mode. The clock is started and stopped by either pressing the Go button on the enclosure, or by tapping Start/Stop. To reset the clock, tap Reset.
Chapter 9: Interval vs. Standard Mode Interval Mode experiments use photogates, or other digital sensors, to record time intervals only. Standard Mode experiments record values from digital or analog sensors on a regular basis. Interval Mode Use Interval Mode to record time intervals with digital sensors such as photogates. With Photogate A enabled, the DataCollector records the time that photogate A’s beam was interrupted - this time is labeled TA. Photogate B is ignored.
IMPORTANT: The DataCollector will record a maximum of three sensors. If you choose to record two digital signals (Photogate A and B) in Standard Mode, you can only record data from one analog sensor. To use both analog sensors (Sensor 1 and Sensor 2), ensure that none is selected for at least one of Photogate A or B. For more information on selecting these settings, see “Data Collection: Setup Window” on page 13. Choosing a Mode Use Table 4 to help you decide between Interval and Standard Mode.
Chapter 10: Connecting to a Computer The DataCollector is designed so that you can easily connect the unit to a computer with a USB cable to transfer data. In addition to uploading and downloading experiment data, you can download software updates.
computer using the included USB cable. Your computer should automatically recognize the device. Next, simply drag and drop the software file from its saved location onto the DataCollector. Safely disconnect your DataCollector from the computer. The DataCollector will automatically install the software updates.
Chapter 11: Warnings and Precautions Please make note of the following warnings and precautions. Failure to follow these guidelines can result in damage to your DataCollector and possibly bodily harm. IMPORTANT: Use only the 9V DC adapter with the DataCollector that has the CPO Science name/logo on it. IMPORTANT: Do not over-tighten the thumbscrew on the photogates.
Warranty Information CPO Science warranties this instrument against defects in materials and workmanship for a period of one year. Repair and/or replacement parts can be obtained from CPO Science by sending the damaged or defective parts to: CPO Science 80 Northwest Blvd. Nashua, NH 03063 1-800-258-1302 support.cpo.com Be sure to fill out the warranty card that came with your kit or register online to receive important information and notification of software updates.