
User's Manual


Monitoring and Troubleshooting
P/N 709C011801
Page 125
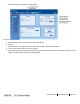
The ONE system element devices are displayed as follows:
Item in Tree Description
System Management Root item, represents the HCM controller (physically installed in the HEU)
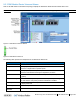
HEU
Headend Unit hosting corresponding modules (ACM, RIM).
NOTE: The HCM controller module is physically installed in the HEU chassis, however in
terms of management is divided into two elements (HCM - System Management and
ACM).
ACM Auxiliary Control Module (both HEU and OIU units host this module)
RIM
RIM modules displayed under host HEU with the number of the slot in which it is
installed (e.g. RIM2)
RIM-M
RIM MIMO modules displayed under host HEU with the number of the slot in which it is
installed (e.g. RIM-M2)
OIU Optical Interface Unit with corresponding modules (ACM, RAU)
OIM
Optical Interface Module under host OIU with the number of the slot in which it is
installed (e.g. OIM3)
RAU RF Antenna Unit. Each RAU is displayed under the host OIM.
RxU RF Expansion Unit. Each RxU is displayed under the host RAU.
Table 9-2. System devices Displayed in Network Topology tree
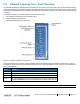
Quickly Finding the Faulty Unit
The color of each unit (except the System Management element - HCM) depends on its local status and on the status of its'
hosted units. The System management element (HCM) will always be colored by the severest color of any of the units under it
or due to its local inputs (or operation). Units name in the tree will consist of the unit type description followed by the user free
text (defined via Module Info tab): e.g. RIM2-"Operator 1 - CELL". The unit’s relative connection (port and slot) will continue
to appear in the elements private window on the top bar
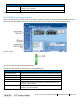
Once the setup and adjustment procedures have been completed successfully for all of the system elements the adjustment
procedures all devices should be displayed in green in the Network Topology tree. In addition, the Event display can be used
to verify that no
new
events are received and that the system is stable.
If fault notifications are received (events) or devices are displayed in red or yellow colors in the Network Topology tree, the
Alarms tab of the relevant devices can be used to source the problem.