
User's Manual


Monitoring and Troubleshooting
P/N 709C011801
Page 123
9 Monitoring and Troubleshooting
IMPORTANT: The available tabs and options in the System Management Web GUI may vary depending on the access level used
to open your session.
9.1 Overview
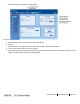
The Web Management Application provides several tools for monitoring and troubleshooting the site. The tools are available in
the Config and in the Events tabs.
The tools include:
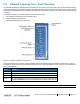
• Network topology tree (on page 123) - provides general view of system status and status of each device (Config tab).
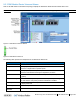
• Device view (on page 125) - fault sourcing at a glance. Device specific view showing the module and main LEDs (Config
tab)
• Device specific alarms (on page 125) - provide detailed information on device alarm viewed in the Topology Tree (Config
tab)
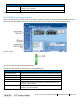
• Display of events (on page 133) - show device fault (trap) notifications such as low power, disconnect, etc.
NOTE: Configuration changes can be viewed in the Activity Log (on page 120).
Figure 9-1. Overview of Fault Sourcing Tools