
User Manual

REVB10/18/12,ECN8972
11
11. DataIntegrityIndicator
TheDataIntegrityboxindicatesoneofthreeconditions:OK,Overflow,orChecksumFailure.
An overflow condition occurs when system resources are inadequate to sustain data
processing at the selected bandwidth.This might be due to CPU speed, insufficient free
memory or cpu/memory‐intensive processes running concurrently with the VibraScout™
application.Anoverflowindicatesalossofsomedatasamples.Theconditioncanusuallybe
eliminated by selecting a lower bandwidth.A Checksum Failure indicates a fault in USB
communication.Ifthisoccurs,checkthecableconnectionbetweenthe7543AandthePC.
12. ClearButton
TheClearbuttonclearstheplotsandthemin,max,meanvalues.Plotsareautomatically
clearedatthestartofeveryacquisition.
13. PlotVerticalAxisScaling
Range and Offset values for each axis can be specified or Auto‐scaling can be selected to
adjustthescalewhenanaccelerationvalueexceedsthecurrentrange.
14. AbsoluteandRelativeMode
InAbsolutemode(Abs),accelerationdataareshownrelativetotheearth'sgravitationalfield
usingthefactorycalibration.InRelativemode(Rel),theaccelerationoffsetsaresubtracted
fromthedatausinguserselectedOffsetvaluesacquiredintheConfigurationscreen.See#6
OffsetsintheConfigurationsection.
15. LogtoFile
DataFileloggingisenabled/disabledbythecheckbox.Thenameofthedatafileandrelated
parametersarefirst specified intheConfiguration screen.If no datafile isspecified in the
Configurationscreenandthischeckbuttonisselected,adatafilepromptmenuwillpopup
requestinganewdatafiletobecreated.
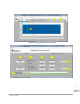
16. FFT
The frequency spectrums of the three acceleration axes are calculated and displayed by
clickingtheFFTbutton.TheFFTisperformedonallplotdata.FFTplotscanbedisplayedin
Linear or Log format and the displayed frequency range is selectable.The maximum
selectablefrequencyisequalto1/2thesamplerate.