
User guide


Composer Pro User Guide
Copyright © 2012 Control4. All Rights Reserved.
Saved: 1/20/2012 1:31:00 PM
200-00005 Composer Pro
User Guide Part 1
Page 173 of 199
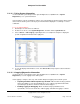
5. Click the Stop Logging button to stop the tool from logging information.
6. Click Open Controller Log to view the logged information in a file.
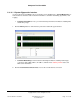
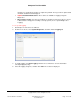
2.10.10.2.3 Viewing Controller Performance Information
Use the Control4
®
Composer Pro System Diagnostics tool (Tools menu > System Diagnostics) to
view Controller performance.
The Controller Performance tab contains information regarding CPU and memory utilization for the
Primary Controller of the project. Asynchronous messages from the Director regarding its current
state are also displayed.
To view Controller Performance information, including CPU and memory usage:
1. Start Composer and connect to a Director.
2. From the Tools menu, select System Diagnostics. The Controller Performance tab is viewable
by default.
3. View information displayed on the Controller Performance tab:
• CPU Usage—Shows a graphical form of current CPU usage and CPU usage history for the
Primary Controller, which is the Control4 Controller used to control the system if multiple
controllers exist on a system.
• Memory Usage—Shows in graphical form the current memory usage and memory history for
the Primary Controller.
• CPU and Memory Usage by Component—Shows percentages of CPU and memory use
per component.