
Zoom out Search Issue


IEEE SIGNAL PROCESSING MAGAZINE [121] MARCH 2015
DISCUSSION
Table 4 summarizes the recommendations for metric usage based
on distortion condition type (i.e., overall, nonenhanced, enhanced,
NFC), assistive device (CI, HA), and the availability or unavailabil-
ity of a reference signal (intrusive or nonintrusive). The recom-
mended metrics include those that attained the highest
sig
t and
lowest
f-RMSE, shown in bold in the table, as well as all others
which attained insignificantly different
sig
t and f-RMSE levels. A
more detailed discussion is given next.
CI: NOISY AND ENHANCED CONDITIONS
For users of CI devices the STOI metric outperformed all other
intrusive measures, thus corroborating the usefulness of the
measure as a channel selection criteria for CI processing [9] (see
Table 4). This was true for both nonenhanced and speech-
enhanced conditions. The NCM metric, on the other hand, despite
having similar processing stages with STOI and achieving
[TABLE 2] PER-CONDITION PERFORMANCE CRITERIA FOR
THE HA NONLINEAR FREQUENCY COMPRESSION QUALITY
DATABASE. THE NUMBERS IN BOLD REPRESENT THE BEST
ATTAINED PERFORMANCES (STATISTICALLY INDIFFERENT)
AMONG ALL TESTED INTRUSIVE AND NONINTRUSIVE
ALGORITHMS.
METRIC
t
spear
t
sig
tf
-RMSE
NCM 0.67 0.67 0.89 7.46
STOI 0.77 0.67 0.92 2.24
PESQ 0.62 0.56 0.79 5.73
HASQI 0.71 0.71 0.93 7.67
HASPI 0.83 0.72 0.81 9.9
PEMO-Q 0.67 0.6 0.79 5.06
PEMO-Q-HI 0.89 0.71 0.92 1.83
P.563 −0.27 −0.38 −0.33 23.25
ModA 0.52 0.48 0.54 8.86
SRMR 0.49 0.59 0.4 17.06
SRMR-HA 0.51 0.58 0.46 14.39
[TABLE 3] PER-CONDITION PERFORMANCE CRITERIA FOR THE HA REVERBERATION/ENHANCEMENT QUALITY DATABASE.
THE NUMBERS IN BOLD REPRESENT THE BEST ATTAINED PERFORMANCES (STATISTICALLY INDIFFERENT) AMONG ALL TESTED
INTRUSIVE AND NONINTRUSIVE ALGORITHMS.
ALL NON-ENHANCED ENHANCED
METRIC
t
spear
t
sig
t
f
-RMSE
t
spear
t
sig
t
f
-RMSE
t
spear
t
sig
t
f
-RMSE
NCM 0.84 0.84 0.83 6.61 0.85 0.81 0.81 8.54 0.77 0.75 0.74 7.67
STOI 0.78 0.78 0.77 6.21 0.81 0.75 0.78 6.26 0.8 0.79 0.77 4.11
PESQ 0.76 0.8 0.81 4.45 0.76 0.74 0.78 5.07 0.7 0.68 0.72 4.59
HASQI 0.73 0.82 0.81 8.02 0.78 0.76 0.77 10.8 0.75 0.83 0.86 5.6
HASPI 0.71 0.86 0.83 12.95 0.8 0.83 0.84 13.23 0.71 0.87 0.9 15.57
PEMO-Q 0.81 0.88 0.86 8.11 0.85 0.8 0.8 10.46 0.77 0.83 0.83 7.91
PEMO-Q-HI 0.84 0.85 0.83 6.23 0.84 0.78 0.77 9.01 0.84 0.85 0.84 4.18
P.563 0.39 0.52 0.52 14.95 0.80 0.78 0.8 7.5 −0.22 −0.15 −0.23 22.38
ModA 0.86 0.9 0.86 10.39 0.83 0.84 0.84 7.16 0.82 0.91 0.9 3.85
SRMR 0.74 0.77 0.74 8.19 0.8 0.78 0.75 9.45 0.39 0.52 0.39 7.64
SRMR-HA 0.79 0.82 0.77 9.9 0.83 0.81 0.75 10.99 0.55 0.63 0.53 7.32
0 0.2 0.4 0.6 0.8 1
0
10
20
30
40
50
60
70
80
90
100
PEMO−Q−HI
Quality
Reference
NFC
0 0.2 0.4 0.6 0.8 1
0
20
40
60
80
100
ModA
(a)
(b)
Quality
Reference
NFC
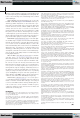
[FIG2] Scatterplots of subjective quality versus objective scores for condition-averaged data points obtained from the (a) PEMO-Q-HI
and (b) ModA metrics for the HA nonlinear frequency compression quality database.
Previous Page | Contents | Zoom in | Zoom out | Front Cover | Search Issue | Next Page
q
q
M
M
q
q
M
M
q
M
THE WORLD’S NEWSSTAND
®
Previous Page | Contents | Zoom in | Zoom out | Front Cover | Search Issue | Next Page
q
q
M
M
q
q
M
M
q
M
THE WORLD’S NEWSSTAND
®