
Zoom out Search Issue


IEEE SIGNAL PROCESSING MAGAZINE [120] MARCH 2015
, (.,,),maxTFMM0005
-RMSE
-RMSE
,ij
j
i
2
2
f
f
=-
eo
(8)
where (.,,)FMM0 05 corresponds to the F-value computed at
a 0.05 significance level. T 0
,ij
= indicates that metrics i and j
achieved statistically equivalent
f -RMSEs, whereas a T 0
,ij
2
indicates that metric i is statistically significant worse than .j
EXPERIMENTAL RESULTS
Table 1 presents the results obtained with four intrusive and
four nonintrusive measures on the CI intelligibility database.
Note that results for HASQI, HASPI, PEMO-Q-HI, and SRMR-
HA have been omitted from the table, as they rely on the
impaired listener’s audiogram, which is not readily available
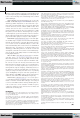
from the CI participants. As can be seen from the table, the
STOI and SRMR-CI measures achieved the highest
sig
t and
lowest
f -RMSE among the tested intrusive and nonintrusive
metrics, respectively. The scatter plots in Figure 1(a) and (b)
depict the subjective versus objective scores obtained for these
two metrics, respectively, along with
their fitted sigmoidal curves.
Table 2, in turn, presents the
results obtained with seven intrusive
and four nonintrusive measures on
the HA nonlinear frequency com-
pression quality database. Note that
the results for SRMR-CI have been
omitted from the table as they rely
on filter bank information from CI
devices. As observed, the PEMO-Q-
HI metric achieved the best
sig
t and
f-RMSE of the intrusive metrics, fol-
lowed closely by the STOI metric
(and the HASQI, in terms of
.)
sig
t
For the nonintrusive metrics, all
tested measures performed poorly, with ModA achieving some-
what better performance. The scatter plots in Figure 2(a) and (b)
depict the subjective versus objective scores obtained for the
PEMO-Q-HI and ModA metrics, respectively, along with their
fitted sigmoidal curves.
Finally, Table 3 presents the results obtained with seven
intrusive and four nonintrusive metrics on the noisy, reverber-
ant, and enhanced HA quality database. As in Table 2, SRMR-CI
is omitted as it was developed for CI users and not HA. As can
be seen, in the nonenhanced condition, all intrusive measures
achieved similar
sig
t values with PESQ achieving the lowest
f-RMSE, followed closely by STOI. For the enhanced condi-
tion, HASPI achieved the highest ,
sig
t but STOI, PESQ, and
PEMO-Q-HI achieved lower
f-RMSE (over three times lower).
For the nonintrusive metrics, ModA outperformed all others
across both the enhanced and nonenhanced conditions. The
scatter plots in Figure 3(a) and (b) depict the subjective versus
objective scores obtained for the PESQ and ModA metrics,
respectively, along with their fitted sigmoidal curves.
[TABLE 1] PER-CONDITION PERFORMANCE CRITERIA FOR THE CI INTELLIGIBILITY
DATABASE. THE NUMBERS IN BOLD REPRESENT THE BEST ATTAINED PERFORMANCES
(STATISTICALLY INDIFFERENT) AMONG ALL TESTED INTRUSIVE AND NONINTRUSIVE
ALGORITHMS.
ALL
NONENHANCED
(NOISE/REVERB) ENHANCED
METRIC
t
spear
t
sig
t
f
-RMSE
t
spear
t
sig
t
f
-RMSE
t
spear
t
sig
t
f
-RMSE
NCM 0.68 0.74 0.87 9.03 0.96 0.93 0.93 8.41 0.47 0.68 0.77 10.33
STOI 0.81 0.76 0.89 7.05 0.97 0.96 0.97 0.6 0.66 0.69 0.92 3.82
PESQ −0.09 0.01 −0.02 26.85 −0.25 0.4 0.14 26.14 −0.09 0.21
−0.02
23.89
PEMO-Q 0.67 0.53 0.68 15.68 0.72 0.8 0.69 15.67 0.38 0.53
0.44
13.52
P.563 0.05 0.38 0.33 23.59 0.76 0.6 0.78 11.77 −0.79 0 −0.43 25.23
ModA 0.78 0.59 0.78 16.88 0.82 0.76 0.8 13.59 −0.13 −0.17
−0.07
18.42
SRMR 0.49 0.53 0.68 18.41 0.93 0.89 0.92 9.6 −0.35 −0.03
−0.37
23.16
SRMR-CI 0.86 0.77 0.93 5.67 0.98 0.98 0.98 2.06 0.65 0.5 0.88 4.65
0 0.2 0.4 0.6 0.8 1
0
10
20
30
40
50
60
70
80
90
STOI
Intelligibility (%)
0
10
20
30
40
50
60
70
80
90
Intelligibility (%)
Clean
Noise Only
Reverb Only
Noise−Plus−Reverb
Enhanced
0 0.2 0.4 0.6 0.8 1
SRMR−CI
(a) (b)
Clean
Noise Only
Reverb Only
Noise−Plus−Reverb
Enhanced
[FIG1] Scatterplots of subjective intelligibility versus objective scores for condition-averaged data points obtained from the (a) STOI
and (b) SRMR-CI metrics for the CI intelligibility database.
Previous Page | Contents | Zoom in | Zoom out | Front Cover | Search Issue | Next Page
q
q
M
M
q
q
M
M
q
M
THE WORLD’S NEWSSTAND
®
Previous Page | Contents | Zoom in | Zoom out | Front Cover | Search Issue | Next Page
q
q
M
M
q
q
M
M
q
M
THE WORLD’S NEWSSTAND
®