
Instruction manual


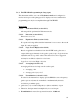

The plot below shows that at approximately 11:22 and 24 seconds, the speed increased
to 1150. When a Threshold is breached, the color of the plot turns red.
After approximately 66 seconds, at approximately11:23 and 30 seconds, the signal
returned to 1000 (between thresholds), then almost immediately dropped to 850,
then back to p onds. 1000 in a proximately 36 sec
90