
Operating instructions

SEA M300USERSGUIDE
DATADISPLAYS
184
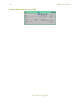
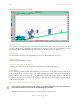
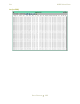
HEIGHTTIMEINDICATOR(HTI.300)
Intensityindbz
The amount of energy which is received back at the radar dish is measured in units of dBZ
(decibels * Reflectivity). The higher the dBZ value the larger the object i.e. large raindrops and hail
produce high dBZ values. This chart gives a reference of the dbz value to the plot color.
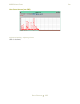
NoiseLevel
The amplitude level of the undesired background noise in dBm (milliwatts of power).
HeightIntensity
Current height and intensity levels.
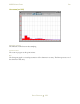
Y‐AxisAltitudeMinimum/Maximum
Changing these values alters the minimum and maximum altitude for the display.
ColorScheme
A user definable parameter which allows multiple color schemes to be applied to the plot. During the
setup of the HTI the user must create a file which identifies the name of the scheme as well as the
color parameters. The name of this file is rdr.300 and is located in the project directory. This file can
be edited at any time but in order for the changes to take effect the project must be opened after the
changes have been made.
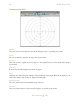
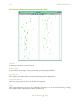
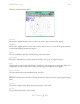
HTI‐Determiningaltitudeandintensityofapoint
Note: Inorderto rece iveavalidintensityread i ng,yo u mu sthaveselectedanareaofthegraphth at has
measurabledataplotted;otherwiseonlytheheightreadingwillbeavailable.
1. Position the mouse pointer over the point on the graph you wish to read.