
Operating instructions
SEA M300USERSGUIDE
DATADISPLAYS
168
Minor
Minor grid lines are shown with one pixel in the M300 display (light). This controls the spacing
between minor grid lines.
Major
Major grid lines are shown with two pixels in the M300 display (heavy). This controls the spacing
between major grid lines.
MinorGridLineType
Allows the user to select different types of line formats for minor grid lines (Solid Lines, Dotted Line,
Dashed Line, Top Mark, Bottom Mark, Both Marks).
MajorGridLineType
Allows the user to select different types of line formats for major grid lines (Solid Lines, Dotted Line,
Dashed Line, Top Mark, Bottom Mark, Both Marks).
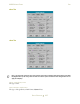
ShiftLeft/Right(x‐Axisonly)
Changes the horizontal shifting of the display to the left or the right, respectively. This is used for
strip chart displays and other types of displays where shifting of the xAxis data is involved.
Label
This controls the spacing of the labels for the grid lines (for y or x axis). It’s typical for the label to
match the minor or major grids.
Min
Sets the minimum x/y limit for the graph (supported displays only).
Max
Sets the maximum x/y limit for the graph (supported displays only).
Range
Sets the maximum range or the graph. For example, for strip chart displays this can be set for the
total amount of time in the xAxis.