
Technical data


Download, testing and diagnostics
CPU 317T: Technology Functions
A5E00251798-03
8-35
Tool Description
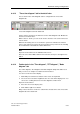
Auxiliary line grid Select "Grid" to show or hide the grid in the diagram.
Phase -270° - 90°
(Bode diagram only)
This menu command changes the view of the phase in the Bode diagram from -
180° to +180° to -270° to +90° um. This range gives you a more precise view of the
3 dB decay.
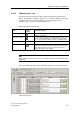
Memo function
active
You may attach notes at any trace position within the diagram.
Using the notepad function:
1. Open the shortcut menu
2. Select "Notepad function" from the shortcut menu.
3. To insert a note, double-click the relevant position in the diagram.
The "Enter note" window opens.
4. type a comment under "Text" and confirm with OK. The diagram shows the
note and its text on a yellow background.
5. Double-click the note to delete it again.
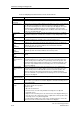
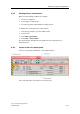
Display trigger line Set "Show trigger line" to indicate the trigger position of the recorded trace in the
diagram. The trigger position is marked with a red triangle.
Active trace Select the scale of which you want to view the scale in the diagram of the y axis.
Auto-scale Select "Auto-scale" to automatically scale the Y coordinate based on the currently
active trace. The diagram shows the full range of the active trace.
Scaling Select "Scaling" to scale the y coordinate of the diagram. In this dialog box, you can
enter new values for the y coordinate.
Arrange traces in
tracks
Select this menu command to output several superimposing traces in the diagram.
The various traces are output at the y coordinate at an offset and overlaying each
other.
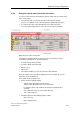
Bit tracks You can configure bit tracing for recorded measurements. This allows you to
explicitly visualize certain bits in the diagram, based on the logged values of a
variable. The function shows a trace for the selected bit in this case. You can also
use this function to monitor the time-based profile of a specific bit of a variable.
Time / FFT diagram Select this menu command to show the time and FFT diagrams in one tab, one
underneath the other. Both diagrams are shown in the time diagram tab, one
underneath the other. Select the entry again to disable it.
Repeated
measurement
Enable "Repetitive measurement" if you want to reuse an existing signal
configuration for your recording (trace color, scaling, for example.)
Superimpose
measurements
Select "Superimpose measurement" to view several traces of different
measurements in the diagram. The function supports visualization of up to eight
traces of different measurements.
Copying a graphic
object to the
clipboard
You can copy the current view in the diagram to the clipboard as graphic object.
You can paste this graphic object into a graphics editor and save it.
Properties Click "Properties" to open the "Diagram properties" dialog box. On this dialog box,
define the line layout for printing the traces, the cache memory for the recording, the
color layout of the diagram and the recording options.