
User Manual


8
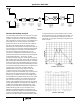
Explanation of Test Points
All measurements were taken using the “Continuous
Transmit” or “Continuous Receive” features of the PTU
diagnostic software. Unless otherwise noted, spectrum
measurements included in this section were obtained using
a Hewlett-Packard 54006A 500Ω probe and 11742A coaxial
blocking capacitor and do not indicate the actual amplitude
of the signal owing to losses associated with the probe.
Unless noted, 11Mbps CCK modulation was employed.
Many of the signals are differential (i.e., balanced with
respect to ground). These are denoted by + (plus) and
- (minus) symbols following the signal name (e.g., RX I+ and
RX I-).
Test Points A- A1, and B-B1
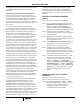
Transmit I and Q:
NOTE: BPSK mode is used for the plots in this figure. Therefore, I
and Q are identical.
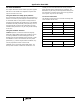
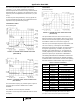
TABLE 1. HIGH GAIN PARAMETERS
PART
REFERENCE NF GAIN OCP OIP3 CUM NF CUM GAIN ICP OIP3 IIP3
UPG152TA2 -227502.00-22950.0052.00
LTF3216L 1 -1 99 99 3.00 -3 29 49.00 52.00
LFSN30172450 2 -2 99 99 5.00 -5 29 47.00 52.00
UPG152TA2 -227507.00-72943.8150.81
HFA3683A 3.7 25 -7.5 12 10.70 18 -25.5 12.00 -6.00
SAW374M 8.5 -8.5 99 99 10.74 9.5 -25.5 3.50 -6.00
HFA3783 7 61 -14.3 1.5 10.90 70.5 -84.8 1.50 -69.00
TABLE 2. LOW GAIN PARAMETERS
PART
REFERENCE NF GAIN OCP OIP3 CUM NF CUM GAIN ICP OIP3 IIP3
UPG152TA 2 -2 27 50 2.00 -2 29 50.00 52.00
LTF3216L 1 -1 99 99 3.00 -3 29 49.00 52.00
LFSN30172450 2 -2 99 99 5.00 -5 29 47.00 52.00
UPG152TA 2 -2 27 50 7.00 -7 29 43.81 50.81
HFA3683A 3.7 -9 -7.5 12 10.70 -16 8.5 11.98 27.98
SAW374M 8.5 -8.5 99 99 24.04 -24.5 8.5 3.48 27.98
HFA3783 7 -72 -14.3 1.5 31.41 -96.5 8.5 -68.52 27.98
FIGURE 7. TRANSMIT I AND Q SIGNALS AT THE OUTPUT
OF THE HFA3861 (TEST POINTS A-A1 AND B-B1)
Application Note 9949