
Manual

40
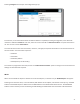
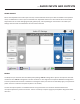
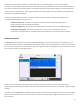
The screen provides real-me graphs of outgoing and incoming packets. Each column represents one second of
outgoing data, segmented into audio coding data (shown in blue) and overhead, such as IP/UDP headers, RTP headers
and similar data (shown in light blue).
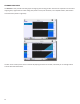
The rst screen shows you the rates in real-me. By swiping the screen to the le, it will show you an average of both
Transmit Rate and Receive Rate.