
Manual

39
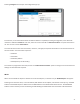
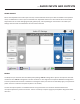
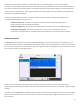
The top meter shows network ulizaon, showing data rate on an autoscaling graph. In the case of CrossLock
connecons using mulple networks (bonding or redundancy mode), the graph will be color-coded to show ulizaon of
each network. Note that CrossLock has license to apporon data dynamically between networks, including making the
choice not to use a network at all. This usually happens when CrossLock determines one network to have signicantly
lower delay and sucient bandwidth.
The boom meter shows loss and error correcon funcons. On good networks, nothing should appear here.
The informaon displayed here is color coded:
- The system has detected a packet has been completely dropped by the
network and was never received by the decoder.
- The system received the packet, but it was too late for decoding and playout.
- The packet was either lost or late, but was recovered by either the
Forward Error Correcon (FEC) or Automac Repeat Query (ARQ) error correcon built into CrossLock.
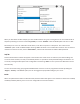
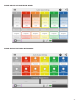
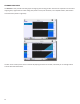
The graph represents the work of the Jier Buer Manager. The area of most interest is the light blue area as
shown below, which illustrates a spread of jier values (referenced to the current playout pointer) over the last second. If
this area covers a large span, the relave jier is high. If the light blue secon of the graph is small or invisible over a me
period, there has been very lile jier present.
Based on the historical value of this jier gure, the buer manager will expand or contract the receive buer
(lengthening and shortening overall delay). The me interval over which this measurement is assessed is called the “jier
window”.
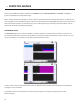
The lower half of the screen display shows a real-me and historical representaon of frame loss. If the decoder
does not receive packets in me, the chart will show an area of red indicang percentage of lost packets over the one-
second interval.