
Manual

38
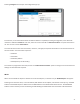
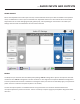
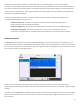
There are three dierent secons available on the menu: and.The dierent
graphs are available by scrolling le and right.
When making a CrossLock connecon, it is best to refer to the CrossLock stats to analyze performance. The Remote and
Channel graphs are also available during a CrossLock connecon because the legacy BRIC Normal protocol is sll running
while a CrossLock connecon is acve. When you are not ulizing CrossLock, CrossLock graphs will be blank, and you
should refer to the Remote and Channel graphs.
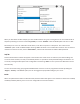
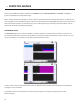
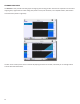
The graphsgive a real-me indicaon of network acvity and quality during a CrossLock connecon. You
can determine how many networks are being ulized, the delay associated with both ends of the connecon, loss and
recovery of packets. It’s a powerful tool to help analyze system performance.
The rst screen is the transmit performance screen. An idencal screen showing receive performance is available by
swiping this screen to the le.
The stascs screens are divided in half into two real-me histograms, moving from right (now) to far le
(60 seconds ago).