
User's Manual
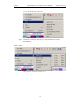
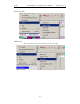
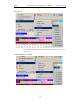
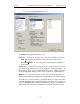
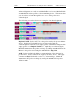
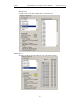
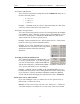
Table Of Contents
- 7. Display Options
- 8. Reading a CATC Trace
- 8.1 Trace View Features
- 8.2 Interpreting the Displayed Information
- 8.3 Tooltips
- 8.4 Set Marker
- 8.5 Edit or Clear Marker
- 8.6 Adding Comments to a Trace File
- 8.7 Expanded and Collapsed Data Formats
- 8.8 Hide Frequency Hops
- 8.9 Hide Nulls and Polls
- 8.10 Menus in Clicked Fields
- 8.11 Hide Unassociated Traffic
- 8.12 Hide Channel
- 8.13 Hide Duplicated Traffic
- 9. Searching Traces
- 10. Decoding Protocols
- 10.1 Introduction
- 10.2 LMP and L2CAP Messages
- 10.3 Decoding and Viewing Higher Protocol Data
- 10.4 Tooltips
- 10.5 Viewing Packets in LMP and L2CAP Messages
- 10.6 Types of LMP and L2CAP Messages
- 10.7 Viewing L2CAP Channel Connections
- 10.8 Viewing Protocol Messages and Transactions
- 10.9 Decoding via the Profiles Toolbar
- 10.10 Changing Protocol Assignments
- 10.11 Encryption
- 10.12 Re-applying Encryption Settings
- 11. Reports & Exporting Data
- Appendix A: Merlin II Clock Calibration
- How to Contact CATC
- Limited Hardware Warranty

117
Merlin II Protocol Analyzer User’s ManualCATC SW Version 2.30
You see the User-Defined Find Events screen:
The Find window divides into three areas:
Left area -- Controls the search level, search direction and search origin.
Find All - Extracts the results and place them in a separate trace.
Search In Hidden - Searches all packets including packets that have
been hidden.
Center area -- Controls the event groups to be searched. The selection you
make will display further choices on the right side of the Find window. At
the bottom are three options called Union, Intersection, and Exclusion that
are used with multi-criteria searches. These options are explained below.
Right area -- Controls the specific events to be searched within the trace.
The box in this right section displays events from the selected Event Group.
The right area is context sensitive -- the Event Group selected in the Center
area will determine what events will display on the right. For example, if
you select Packet Type, the Right area will show you a list of packet types.
Bold entries in the list represent items that actually occurred in the trace.