
User's Manual
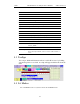
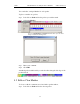
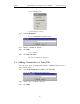
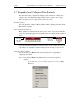
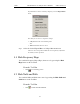
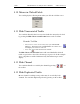

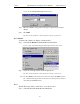
Table Of Contents
- 7. Display Options
- 8. Reading a CATC Trace
- 8.1 Trace View Features
- 8.2 Interpreting the Displayed Information
- 8.3 Tooltips
- 8.4 Set Marker
- 8.5 Edit or Clear Marker
- 8.6 Adding Comments to a Trace File
- 8.7 Expanded and Collapsed Data Formats
- 8.8 Hide Frequency Hops
- 8.9 Hide Nulls and Polls
- 8.10 Menus in Clicked Fields
- 8.11 Hide Unassociated Traffic
- 8.12 Hide Channel
- 8.13 Hide Duplicated Traffic
- 9. Searching Traces
- 10. Decoding Protocols
- 10.1 Introduction
- 10.2 LMP and L2CAP Messages
- 10.3 Decoding and Viewing Higher Protocol Data
- 10.4 Tooltips
- 10.5 Viewing Packets in LMP and L2CAP Messages
- 10.6 Types of LMP and L2CAP Messages
- 10.7 Viewing L2CAP Channel Connections
- 10.8 Viewing Protocol Messages and Transactions
- 10.9 Decoding via the Profiles Toolbar
- 10.10 Changing Protocol Assignments
- 10.11 Encryption
- 10.12 Re-applying Encryption Settings
- 11. Reports & Exporting Data
- Appendix A: Merlin II Clock Calibration
- How to Contact CATC
- Limited Hardware Warranty

112
Merlin II Protocol Analyzer User’s ManualCATC SW Version 2.30
You see the Go to Packet/Message/Protocol window:
Step 2 Enter the number of the packet, message or protocol you want to
display.
Step 3 Click OK.
The Trace View repositions to show the packet at the top of your screen.
Go to Marker
To instruct the analyzer to display a marked packet,
Step 1 Select Go to Marker under Search on the Menu Bar.
You see a drop-down menu listing the marked packets in that Trace View:
Step 2 Select the desired packet from the displayed list.
The Trace View repositions to show the packet at the top of your screen.
Note The Go to Marker feature functions in conjunction with the Set Marker feature.
The comments within the parentheses following each marked packet are added or
edited with the Set Marker feature.
Go to
The Go To feature takes you directly to an event in a Trace.
Step 1 Select Go To under Search on the Menu Bar.