
User's Manual
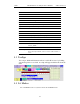
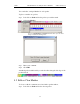
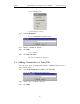
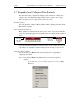
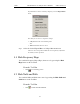

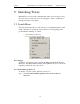
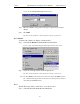
Table Of Contents
- 7. Display Options
- 8. Reading a CATC Trace
- 8.1 Trace View Features
- 8.2 Interpreting the Displayed Information
- 8.3 Tooltips
- 8.4 Set Marker
- 8.5 Edit or Clear Marker
- 8.6 Adding Comments to a Trace File
- 8.7 Expanded and Collapsed Data Formats
- 8.8 Hide Frequency Hops
- 8.9 Hide Nulls and Polls
- 8.10 Menus in Clicked Fields
- 8.11 Hide Unassociated Traffic
- 8.12 Hide Channel
- 8.13 Hide Duplicated Traffic
- 9. Searching Traces
- 10. Decoding Protocols
- 10.1 Introduction
- 10.2 LMP and L2CAP Messages
- 10.3 Decoding and Viewing Higher Protocol Data
- 10.4 Tooltips
- 10.5 Viewing Packets in LMP and L2CAP Messages
- 10.6 Types of LMP and L2CAP Messages
- 10.7 Viewing L2CAP Channel Connections
- 10.8 Viewing Protocol Messages and Transactions
- 10.9 Decoding via the Profiles Toolbar
- 10.10 Changing Protocol Assignments
- 10.11 Encryption
- 10.12 Re-applying Encryption Settings
- 11. Reports & Exporting Data
- Appendix A: Merlin II Clock Calibration
- How to Contact CATC
- Limited Hardware Warranty

111
Merlin II Protocol Analyzer User’s ManualCATC SW Version 2.30
9. Searching Traces
Merlin II has several search commands that enable you to navigate a trace
in search of key events such as errors and triggers. These commands are
launched from the search menu.
9.1 Search Menu
The Search menu provides several options for searching through recorded
traffic, allowing you to find specific packets based on triggering status,
packet number, marking, or content.
• Click Search in the Menu bar.
You see the Search drop-down menu:
Go to Trigger
To display a triggering event, select Go to Trigger under Search on the
Menu bar. The Trace Viewer display will reposition the trace to show the
triggering event at the top of the screen.
Go to Packet/Message/Protocol
To display a specific packet, Message or Protocol
Step 1 Select Go to Packet/Message/Protocol under Search on the
Menu Bar.