
User's Manual
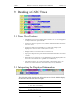
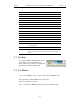
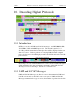
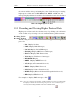
Table Of Contents
- Table of Contents
- 1. Overview
- 2. Quick Installation
- 3. Detailed Installation
- 4. Updates
- 5. Software Overview
- 6. Recording Wizard
- 7. Recording Options
- 8. Display Options
- 9. Reading a CATC Trace
- 10. Decoding Higher Protocols
- 10.1 Introduction
- 10.2 LMP and L2CAP Messages
- 10.3 Decoding and Viewing Higher Protocol Data
- 10.4 Tooltips
- 10.5 Viewing Packets in LMP and L2CAP Messages
- 10.6 Types of LMP and L2CAP Messages
- 10.7 Viewing L2CAP Channel Connections
- 10.8 Viewing Protocol Messages and Transactions
- 10.9 Changing Protocol Assignments
- 11. Other Features
- How to Contact CATC
- Warranty and License
- Index

103
BTTracer Protocol Analyzer User’s ManualCATC Version 1.0
9. Reading a CATC Trace
9.1 Trace View Features
• The BTTracer packet view display makes extensive use of color and graphics
to fully document the captured traffic.
• Packets are shown on separate rows, with their individual fields both labeled
and color coded.
• Packets are numbered (sequentially, as recorded), time-stamped, and
highlighted to show the device status (master or slave).
• Display formats can be named and saved for later use.
• Pop-up Tool Tips annotate packet fields with detailed information about their
contents.
• Data fields can be collapsed to occupy minimal space in the display (which can
in turn be zoomed in and out to optimize screen utilization).
• The display software can operate independent of the hardware and so can
function as a stand-alone Trace Viewer that may be freely distributed.
9.2 Interpreting the Displayed Information
The following table describes the abbreviations used in the Merlin display.
Packet #0 is described from left to right:
Packet:# Packet/Event Number
T/M, T/S M =Master Device Transmitting
S = Slave Device Transmitting
Freq Current Hop Frequency (in MHz)
Pre Preamble of the Sync word