
User's Manual
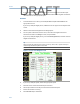
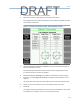
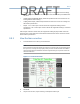
Table Of Contents
- Home
- Contents
- CSI 2140 Machinery Health Analyzer
- Introduction to the analyzer
- Transfer files with CSI 2140
- AMS Machinery Manager Data Transfer
- AMS Machinery Manager Standalone Data Transfer application
- Communication setup
- Routes and jobs
- Load a route from AMS Machinery Manager into the analyzer
- Load multiple routes from AMS Machinery Manager to the analyzer
- Load a Balance job from AMS Machinery Manager into the analyzer
- Dump a job from the analyzer to AMS Machinery Manager
- Dump a route from the analyzer to AMS Machinery Manager
- Dump a route or job from the analyzer to a folder on a computer
- Analyzer firmware and programs
- Screen captures
- Splash screens
- Printing
- Route
- Route overview
- Manage routes
- Set data collection and display parameters
- Set the plot type for collected data
- Enable or disable Point Advance to automatically move to the next measurement point
- Set High Frequency Detection averages
- Set the route data storage mode
- Set the overlap
- Set the plot type for live data
- Set the overall mode
- Set the integrate mode
- Enable or disable multi-channel group data collection
- Display a summary of data collected for grouped measurement points
- View or hide warning alarms on the Route Data Collection screen
- Restore default values for route data collection and display parameters
- Override the sensor setup for a route
- Enter new speed or load for a measurement point
- Tachometers
- Multiple inputs and measurements
- Collect route data
- Notes
- Plot data
- Run Analyze to collect data for a route measurement point
- View the measurement point setup and history
- Route reports
- Plots
- Analyze and Advanced Analyze
- Analyze overview
- Manage jobs
- Job Setup
- View all saved Analyze jobs
- Create an Analyze job
- Open a saved Analyze job
- Change the job ID
- Edit the equipment ID and description in a job
- Edit the measurement ID and description in a job
- Add a measurement
- Delete a measurement
- Delete data from the current measurement point
- Save a job to equipment in a route
- Set display parameters
- Multi-input measurements
- Sensors and inputs
- Tachometers
- Common data collection parameters
- Collecting data using an Analysis Expert
- Recommended uses of Analysis Experts
- Enable or disable the help text in the Analysis Experts
- High Frequency Analysis
- High Resolution Analysis
- Bearing/Gear Analysis - PeakVue
- Low Frequency Analysis - Slow Speed Technology
- Turning Speed Detection
- Laser Speed Detection
- Bump Tests
- Bump Test Equipment Off
- Bump Test Equipment Running
- Coast Down Peak Hold
- Coast Down Peak and Phase
- Rotor Bar Test Motor Current
- Order Tracking
- Synchronous Analysis
- Synchronous Analysis and Synchronous Averaging
- Orbit Plot
- Cross Channel Amplitude/Phase
- Collect data using Manual Analyze
- Listen to live vibration data in Analyze
- Redo a measurement
- Store data to a route or a job
- Review collected data
- Print an Analyze plot to AMS Machinery Manager
- Print a plot to a memory card
- Reset Analyze defaults
- Advanced Transient
- ODS/Modal
- ODS/Modal overview
- Manage jobs
- Sensors and inputs
- Tachometers
- Set up the plots
- Set up the job
- Collect ODS/Modal data
- Display the data for a measurement point
- Print an ODS/Modal plot to AMS Machinery Manager
- Print an ODS/Modal plot to a memory card
- Balance
- Balance overview
- Manage jobs
- Job Setup
- Sensor Setup
- Measurement Plane Setup
- Weight Plane Setup
- Acquire Data
- Balance correction
- Trim run
- One-run balance job
- Notes
- Balance summary reports
- Review balance data
- Manually enter balance job data
- Calculator Mode
- Determine another location to place weights
- Combine multiple weights on a rotor
- Calculate a new balance solution to use only the available weights
- Calculate weight placement using static and couple components
- Estimate trial weights
- Calculate weight location around the outside rotor circumference
- Calculate new balance solution to use only available locations and weights
- Amplification Factor
- Convert magnitude or frequency values to a different measurement unit
- Tips and additional information
- Balance accessories
- Technical specifications
- Glossary
- Index

Collect data until the magnitude is stable and phase varies by no more than 5
degrees in the Data Stability graph.
8.
Press Accept Data.
9. Repeat the steps above for all measurement points for all trim runs.
If you select Auto for the mux option, the Balance program automatically accepts
the data and moves to the next point when the phase and magnitude are good for 3
consecutive averages. See Section 9.4.5.
10. Press Next Step to review the data.
Review the data on the Tolerance Check screen and ensure the vibration is within
the balance specification.
11. Press Enter.
If you have multiple planes, press Enter to view the Tolerance Check screen for each
plane. The Acquire Trim Data step is completed.
12. Press Next Step.
You must complete the Applied Weight, Acquire Trim Data, and Tolerance Check steps to
complete a trim run and store the data to the job. If the X does not appear on the Balance
main menu, the analyzer did not save the data, and you cannot transfer the data to AMS
Machinery Manager.
9.9.2 Tolerance check for the Trim Run
After you complete your trim runs, the Balance program runs a Tolerance Check for each
measurement plane.
If your correction is significantly different, the problem may be inaccurate data or weight
placement, variable system response due to large reductions in magnitude, or other
causes of system non-linearity. Additional trim corrections from the same data may also be
inaccurate. Repeat reference and trim runs to establish new influence coefficients.
The Tolerance Check plot displays all the readings for each point in each plane separately.
The Tolerance Check diagram shows the phase and magnitude changes for one
measurement plane at a time. The symbols for each measurement point show where the
initial data vectors’ end points were located. Up to two additional points are plotted by the
lines leading from the symbols. These show the data from the last two Check Results runs.
Whenever the magnitude is equal to or less than the defined balance specification, the
magnitude reading is highlighted green.
• A target circle in the center indicates the balance specification defined under Job
Setup. You want the vector to be within this circle. Use Expand Scale and Decrease Scale
to change the plot scaling.
• The symbol for each measurement point at the location of the reference run reading
for that point.
Balance
222
DRAFT