
User's Manual
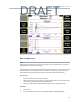
Table Of Contents
- Home
- Contents
- CSI 2140 Machinery Health Analyzer
- Introduction to the analyzer
- Transfer files with CSI 2140
- AMS Machinery Manager Data Transfer
- AMS Machinery Manager Standalone Data Transfer application
- Communication setup
- Routes and jobs
- Load a route from AMS Machinery Manager into the analyzer
- Load multiple routes from AMS Machinery Manager to the analyzer
- Load a Balance job from AMS Machinery Manager into the analyzer
- Dump a job from the analyzer to AMS Machinery Manager
- Dump a route from the analyzer to AMS Machinery Manager
- Dump a route or job from the analyzer to a folder on a computer
- Analyzer firmware and programs
- Screen captures
- Splash screens
- Printing
- Route
- Route overview
- Manage routes
- Set data collection and display parameters
- Set the plot type for collected data
- Enable or disable Point Advance to automatically move to the next measurement point
- Set High Frequency Detection averages
- Set the route data storage mode
- Set the overlap
- Set the plot type for live data
- Set the overall mode
- Set the integrate mode
- Enable or disable multi-channel group data collection
- Display a summary of data collected for grouped measurement points
- View or hide warning alarms on the Route Data Collection screen
- Restore default values for route data collection and display parameters
- Override the sensor setup for a route
- Enter new speed or load for a measurement point
- Tachometers
- Multiple inputs and measurements
- Collect route data
- Notes
- Plot data
- Run Analyze to collect data for a route measurement point
- View the measurement point setup and history
- Route reports
- Plots
- Analyze and Advanced Analyze
- Analyze overview
- Manage jobs
- Job Setup
- View all saved Analyze jobs
- Create an Analyze job
- Open a saved Analyze job
- Change the job ID
- Edit the equipment ID and description in a job
- Edit the measurement ID and description in a job
- Add a measurement
- Delete a measurement
- Delete data from the current measurement point
- Save a job to equipment in a route
- Set display parameters
- Multi-input measurements
- Sensors and inputs
- Tachometers
- Common data collection parameters
- Collecting data using an Analysis Expert
- Recommended uses of Analysis Experts
- Enable or disable the help text in the Analysis Experts
- High Frequency Analysis
- High Resolution Analysis
- Bearing/Gear Analysis - PeakVue
- Low Frequency Analysis - Slow Speed Technology
- Turning Speed Detection
- Laser Speed Detection
- Bump Tests
- Bump Test Equipment Off
- Bump Test Equipment Running
- Coast Down Peak Hold
- Coast Down Peak and Phase
- Rotor Bar Test Motor Current
- Order Tracking
- Synchronous Analysis
- Synchronous Analysis and Synchronous Averaging
- Orbit Plot
- Cross Channel Amplitude/Phase
- Collect data using Manual Analyze
- Listen to live vibration data in Analyze
- Redo a measurement
- Store data to a route or a job
- Review collected data
- Print an Analyze plot to AMS Machinery Manager
- Print a plot to a memory card
- Reset Analyze defaults
- Advanced Transient
- ODS/Modal
- ODS/Modal overview
- Manage jobs
- Sensors and inputs
- Tachometers
- Set up the plots
- Set up the job
- Collect ODS/Modal data
- Display the data for a measurement point
- Print an ODS/Modal plot to AMS Machinery Manager
- Print an ODS/Modal plot to a memory card
- Balance
- Balance overview
- Manage jobs
- Job Setup
- Sensor Setup
- Measurement Plane Setup
- Weight Plane Setup
- Acquire Data
- Balance correction
- Trim run
- One-run balance job
- Notes
- Balance summary reports
- Review balance data
- Manually enter balance job data
- Calculator Mode
- Determine another location to place weights
- Combine multiple weights on a rotor
- Calculate a new balance solution to use only the available weights
- Calculate weight placement using static and couple components
- Estimate trial weights
- Calculate weight location around the outside rotor circumference
- Calculate new balance solution to use only available locations and weights
- Amplification Factor
- Convert magnitude or frequency values to a different measurement unit
- Tips and additional information
- Balance accessories
- Technical specifications
- Glossary
- Index

the recorded frequency is a resonance and no other background vibration. A multi-channel
measurement records the amount of force applied with an instrumented impact hammer
on one channel and records the response on a second channel.
For the Impact test, you can use the triaxial accelerometer and one input for the impact
hammer. This allows you to do one impact and collect all three measurement directions,
which makes data collection faster.
Impact testing and modal analysis
Impact testing identifies resonant frequencies. If you perform the impact tests at enough
points, the modal analysis software can use the data to animate the structure. The
animation lets you see how the structure vibrates at each of the resonant frequencies.
Complete a modal analysis experimentally or numerically. Finite Element Analysis (FEA) is a
numerical method of modal analysis. Experimental Modal Analysis (EMA) is often done
using modal analysis software that lets you see the modes of vibration at each of the
resonant frequencies measured during the impact tests.
You need only a few measurement points to identify resonant frequencies. Modal analysis
often involves 10 or more measurement locations measured horizontally, vertically,
and/or axially.
Impact plots
When you display impact plot data, use the F2 Next Response Input key to switch between
other inputs. Waveform plots for Impact acquisitions show the shape of the Force/
Exponential window used when calculating the spectrum. The shape of the Force/Exponential
windows are calculated using the Start, Width, Taper, and Decay values you set up. See
Section 6.7.3. This shape makes sure the window setup values are correct. The amplitudes
of the window overlays are not scaled to the plot. Only the general shape of the window as
it relates to the waveform data in time is important. The window overlays are shown by
default during live-time plotting. You can clear these from the plots.
Analyze and Advanced Analyze
136
DRAFT