
User's Manual
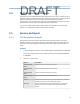
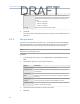
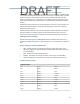
Table Of Contents
- Home
- Contents
- CSI 2140 Machinery Health Analyzer
- Introduction to the analyzer
- Transfer files with CSI 2140
- AMS Machinery Manager Data Transfer
- AMS Machinery Manager Standalone Data Transfer application
- Communication setup
- Routes and jobs
- Load a route from AMS Machinery Manager into the analyzer
- Load multiple routes from AMS Machinery Manager to the analyzer
- Load a Balance job from AMS Machinery Manager into the analyzer
- Dump a job from the analyzer to AMS Machinery Manager
- Dump a route from the analyzer to AMS Machinery Manager
- Dump a route or job from the analyzer to a folder on a computer
- Analyzer firmware and programs
- Screen captures
- Splash screens
- Printing
- Route
- Route overview
- Manage routes
- Set data collection and display parameters
- Set the plot type for collected data
- Enable or disable Point Advance to automatically move to the next measurement point
- Set High Frequency Detection averages
- Set the route data storage mode
- Set the overlap
- Set the plot type for live data
- Set the overall mode
- Set the integrate mode
- Enable or disable multi-channel group data collection
- Display a summary of data collected for grouped measurement points
- View or hide warning alarms on the Route Data Collection screen
- Restore default values for route data collection and display parameters
- Override the sensor setup for a route
- Enter new speed or load for a measurement point
- Tachometers
- Multiple inputs and measurements
- Collect route data
- Notes
- Plot data
- Run Analyze to collect data for a route measurement point
- View the measurement point setup and history
- Route reports
- Plots
- Analyze and Advanced Analyze
- Analyze overview
- Manage jobs
- Job Setup
- View all saved Analyze jobs
- Create an Analyze job
- Open a saved Analyze job
- Change the job ID
- Edit the equipment ID and description in a job
- Edit the measurement ID and description in a job
- Add a measurement
- Delete a measurement
- Delete data from the current measurement point
- Save a job to equipment in a route
- Set display parameters
- Multi-input measurements
- Sensors and inputs
- Tachometers
- Common data collection parameters
- Collecting data using an Analysis Expert
- Recommended uses of Analysis Experts
- Enable or disable the help text in the Analysis Experts
- High Frequency Analysis
- High Resolution Analysis
- Bearing/Gear Analysis - PeakVue
- Low Frequency Analysis - Slow Speed Technology
- Turning Speed Detection
- Laser Speed Detection
- Bump Tests
- Bump Test Equipment Off
- Bump Test Equipment Running
- Coast Down Peak Hold
- Coast Down Peak and Phase
- Rotor Bar Test Motor Current
- Order Tracking
- Synchronous Analysis
- Synchronous Analysis and Synchronous Averaging
- Orbit Plot
- Cross Channel Amplitude/Phase
- Collect data using Manual Analyze
- Listen to live vibration data in Analyze
- Redo a measurement
- Store data to a route or a job
- Review collected data
- Print an Analyze plot to AMS Machinery Manager
- Print a plot to a memory card
- Reset Analyze defaults
- Advanced Transient
- ODS/Modal
- ODS/Modal overview
- Manage jobs
- Sensors and inputs
- Tachometers
- Set up the plots
- Set up the job
- Collect ODS/Modal data
- Display the data for a measurement point
- Print an ODS/Modal plot to AMS Machinery Manager
- Print an ODS/Modal plot to a memory card
- Balance
- Balance overview
- Manage jobs
- Job Setup
- Sensor Setup
- Measurement Plane Setup
- Weight Plane Setup
- Acquire Data
- Balance correction
- Trim run
- One-run balance job
- Notes
- Balance summary reports
- Review balance data
- Manually enter balance job data
- Calculator Mode
- Determine another location to place weights
- Combine multiple weights on a rotor
- Calculate a new balance solution to use only the available weights
- Calculate weight placement using static and couple components
- Estimate trial weights
- Calculate weight location around the outside rotor circumference
- Calculate new balance solution to use only available locations and weights
- Amplification Factor
- Convert magnitude or frequency values to a different measurement unit
- Tips and additional information
- Balance accessories
- Technical specifications
- Glossary
- Index

Option Description
Peak Hold Average Display the largest amplitude of each spectral line. Use this
option during a machine coast down or to monitor random
fluctuations such as steam whirl or oil whirl.
Synchronous Time Remove the vibration of other machines from the signal, so
only the vibration from the reference machine remains. The
analyzer synchronizes each data sample with a tachometer
pulse, computes the average, and creates the spectrum
from the averaged waveform.
Use Synchronous Time when you need data directly related to
the turning speed of a specific shaft, or when several
machines or shafts on one machine turn at slightly different
speeds.
Note
A tachometer is required with this mode.
Order Tracking Monitor machines where the speed is changing during data
collection. Order Tracking helps normalize data so it does not
look smeared. You must use a tachometer and a reference
pulse. A tachometer pulse controls the data acquisition rate
to account for variations in machine RPM.
Negative Average Dynamically subtract one spectra from another while the
machine runs. Negative Average reduces the number of
spectra and compares the results with the results of a
normal averaging or with bump test data to help isolate
potential problems. The larger the number of spectra used
for averaging, the more the noise spikes in vibration signals
are reduced, and the more accurately true spectral peaks are
represented.
Exponential Average Average each new spectra with all prior ones in the decay
exponential form, where the rate of decay is set by the
averages value. A smaller average shows the vibration with a
faster decay or rate of change. Use this advanced method if
vibration behavior varies significantly during measurement.
Note
Do not use for routine data collection.
6.7.5 PeakVue and demodulation
The analyzer can use PeakVue technology or demodulation when collecting data. PeakVue
technology samples data faster than demodulation to detect high-frequency stress waves.
PeakVue data is trendable, but demodulation is not.
Analyze and Advanced Analyze
102
DRAFT