
Manual Chapter 5

5-37
View Data
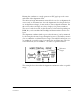
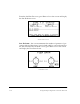
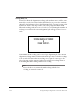
4 Point - View Data – this screen appears first if using the 4 point methods
or immediately following the sine fit information if using the sweep
methods. Data cannot be edited and is simply provided for the conve-
nience of those who are accustomed to recording the data in this manner
or who wish to use this data to perform a graphical solution on paper. To
see the “raw data,” (the position of the beam on each target) press the 0 key.
To return the top reading to zero, press the 0 key again. Press Enter to leave
this screen.
8
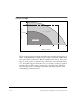
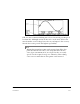
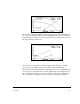
Vertical Log – this is an enlarged version of the vertical plot shown on the
dual plot. In addition to the misalignment based on the two most recent
alignment measurements, all previous measurements are shown. The Left/
Right arrow keys may be used to move a cursor to each plotted point. The
corresponding angle and offset will be displayed. The Up/Down arrows
can be used to change the overall plot scaling.
To view the Acceptable and excellent tolerances press the Alt and Page Up
keys. To return to the optimum scale press the Alt and Page Down keys.