
Manual Chapter 5

5-28 Using UltraSpec Alignment - General Overview
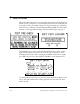
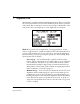
View Data
Dual Tolerance Plot
After acquiring data, the view data function allows you to check the accept-
ability of the current alignment. Both the vertical and the horizontal rela-
tionships are plotted as well as the calculated values for angle and offset or
left angle and right angle. The bold crosshair shows the current condition,
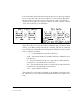
whereas a faint crosshair is drawn to show the previous position. Use the
Up/Down arrow keys to change the plot scaling if needed. The area under
the lowest arc is the excellent range. The area under the higher arc and
above the lower arc represents the acceptable range. Pressing Enter will
return the user to the main menu.