
User`s manual


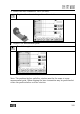

The detailed screen shows a curve over a limited number of the measurement
points at a time. The measurement point number, Y-and X-values and
eventually comment are shown for the measurement point that is marked in
the diagram. The diagram scale is also shown below the diagram. Y- and X-
values at different points can be looked at by scrolling.
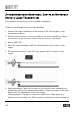
Evaluation of measurement result
The result is presented in relation to selected references. The direction is
depending on how the receiver is placed. If the receiver is placed according
to the mounting instructions Y-values are showing the vertical direction and
X-values the horizontal direction.
In the vertical direction (Y) positive values mean that the measurement
object at this point is high and negative values that the measurement object
is low.
In the horizontal direction (X, looking at the receiver from the laser
transmitter) positive values mean that the measurement object at this point
is to the left and negative values that the measurement object is to the right.
In the diagrams upwards correspond to positive values (if this is not changed
in the application set-up.)
A result box with a filled triangle in the upper right corner shows
that the value is fixed (not live).
104