
Technical data


86 HP Surestore FC Switch 6164 Installation and Reference Guide
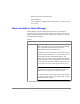
Accessible from Switch View:
Port
Information
View
Displays statistics and status for the selected port, GBIC,
or loop. Also provides options for managing loops.
Accessed by clicking the icon for the relevant port in
Switch View.
Power Supply
Status
The Power Supply icons on the switch graphic indicate
the number of power supplies present, and the LED on
the power supply indicates the status of the power
assemblies.
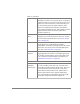
Switch Events
View
Displays the error log for the switch. Accessed by
clicking Events in Switch View. This view can also be
accessed through Fabric View (see “Fabric View” on
page 83).
Telnet Interface Provides an interface for using Telnet commands for
switch diagnostics, troubleshooting, and detailed fabric
management. Accessed by clicking Telnet in Switch
View. This view can also be accessed through Fabric
View (see “Fabric View” on page 83).
Fabric Watch
View
Monitors fabric elements and displays error and
performance counter status, issuing an alert when
conditions are out of acceptable ranges. Accessed by
clicking Watch in Switch View.
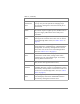
Fan Icon The color of this icon indicates the overall status of the
fans (see the color legend in Fabric View).
Administrative
Interface
Provides an interface for performing functions such as
upgrading firmware versions or reconfiguring a switch.
Accessed by clicking Admin in Switch View. This view
can also be accessed through Fabric View (see “Fabric
View” on page 83).
Performance
View
Graphically portrays real-time data throughput for each
port and displays total switch bandwidth utilization.
Accessed by clicking Perf in Switch View.
Table 10. (continued)