
Technical data


Introducing Fabric Manager 83
– information about connected devices
– loop information
– port performance including frame counts (frames in, frames out) and
error counts
Views Available in Fabric Manager
Fabric Manager provides information about and access to the fabric
through a series of separate windows, making it possible to view several
aspects of the fabric at the same time. Following is a summary of the views
available in Fabric Manager.
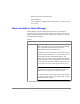
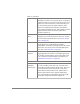
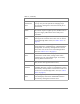
Table 10.
Initial Display When Fabric Manager is Connected to the Fabric:
Fabric View Includes a control panel that provides access to
fabric-wide options, a panel for each switch in the fabric,
plus a legend that explains the meaning of the
background colors on the Switch icons.
Each panel contains an icon that represents the switch or
integrated fabric, in addition to icons for Switch Events
and the Administrative and Telnet interfaces. The
background color of the switch icon represents the status
of that particular switch or integrated fabric (as defined
by the legend provided in the window). Fabric View also
provides access to fabric-wide options such as zoning.
Note
Switch status is calculated approximately once per
second; however the initial calculation does not occur
until 30 to 60 seconds after the switch is booted.
For all statuses that are based on errors per time interval,
any errors cause the status to show faulty until the entire
sample interval has passed.