
Technical data


159
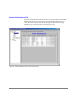
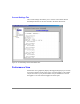
In addition to the port graphs, a graph for the entire switch is provided at
the bottom of the window. Resizing the window changes the size and shape
of all the individual graphs.
In both the port and switch graphs, the horizontal axis represents elapsed
time and the vertical axis represents throughput. Each port graph contains
up to 60 seconds of performance data, and the switch graph at the bottom of
the view can contain up to 4 minutes of data.
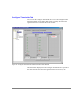
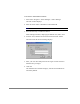
Administrative Interface
The Administrative Interface provides access to the administrative
functions though the following tabs:
• “Switch Admin Tab” on page 161
• “User Admin Tab” on page 164
• “Firmware Upgrade Tab” on page 165
• “Reboot Switch Tab” on page 167
• “SNMP Admin Tab” on page 168
• “License Admin Tab” on page 170
• “Remote Switch Tab (Optional Software)” on page 171
• “QuickLoop Admin Tab” on page 172
• “Config Admin Tab” on page 175
• “Extended Fabric Tab (Optional Software)” on page 177
Note
The Administrative Interface requires administrative privileges.
When an administrative login is entered, administrative privileges remain
available from that workstation until the web browser is exited.