
Technical data


Using Fabric Manager 111
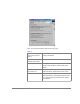
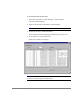
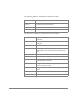
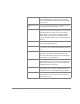
Table 12 describes the columns in the Fabric Events view:
Fabric Topology View
Fabric Topology View summarizes the physical configuration of the fabric
from the perspective of the “local domain,” which is the domain of the
switch entered as a URL in the web browser. This includes information
about the “destination domains,” which are all other domains in the fabric,
and the paths between each destination domain and the local domain.
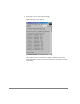
To access Fabric Topology View:
1. Select Start >Programs > Fabric Manager > Fabric Manager.
The URL window displays.
2. Enter the switch name or IP address in the blank field.
Note
This switch is assumed to be the local domain.
3. Press the Enter key to submit the address.
Fabric Manager launches, displaying the default view, Fabric View.
Table 12.
Switch Name of switch.
Num... (number) Event number for affected switch.
Time Time of event.
Count Number of consecutive occurrences of same event.
Level Severity level of event:
0 panic (switch reboots)
1 critical
2error
3 warning
4 information
5 debug
Message Description of event.