
Technical data
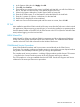
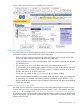
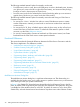
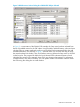
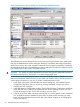
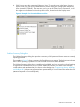
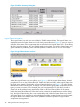
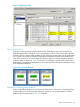
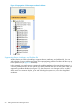

Figure 7 Logical Status View
System Status Window
If you are monitoring several systems simultaneously, OSM offers a more convenient tracking
method of systems than resizing all of your Management windows. Select System Status from the
Summary menu to create a small, separate window displaying just the system icon for each system.
You can then minimize (but not close) all Management windows and track system health by the
color of the system icon. An icon changes from green to yellow to indicate degraded conditions
within the system or cluster (as Figure 8 illustrates). To investigate a system icon that turns yellow,
maximize the corresponding Management window and expand the tree pane to identify the source
of the degraded conditions.
Figure 8 System Status Windows
Propagation of Subcomponent Problems
Alarms and problem attributes on resources in the OSM Service Connection are propagated up
to parent objects. The OSM Tree pane displays a special icon over parent objects to indicate
problems with subcomponents (as Figure 9 illustrates).
OSM Service Connection 49