
Technical data
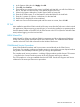
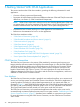
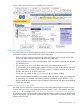
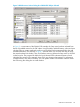
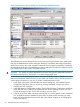
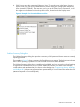
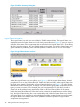
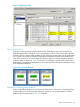
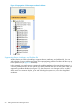

Figure 5 Problem Summary Dialog Box
Logical Status Information
The Logical Status icon and view are included in T0682 AAM and later. The Logical Status icon,
displayed next to the System Status icon in the View pane toolbar (see Figure 6), gives you a quick
indicator of the status of the components that are included in the Logical Status view – those being
all disks, logical processors, LIFs, and SWAN paths on the system. As with the System Status icon,
green indicates no problems; yellow indicates problem conditions exist on one or more object.
Figure 6 Logical Status Button and Icon
When the Logical Status icon turns yellow, as in Figure 6, click the Logical Status button, located
just above the icon on the OSM toolbar (for T0682 H02 ABU and later, select Logical Status from
the Tools menu instead). This displays a Logical Status dialog box (see Figure 7). It works like the
Multi-Resource Actions dialog box, in that you can select which Logical Status component resource
types you want to monitor. In this example, the user has selected the FC disk object, to take a
closer look at all problems being reported by OSM on all Fibre Channel disks on the system.
Unlike the personalized Resource Views that can be created in the Multi-Resource Actions dialog
box, the Logical Status dialog box is not customizable. And unlike the System Status icon, which
will remain green if you suppress (or acknowledge) all problem conditions that exist on the system,
the Logical Status icon remains yellow even if problem conditions reported on Logical Status
components are suppressed.
48 Getting Started With OSM Applications