
Specifications


Troubleshooting Resources 4–37
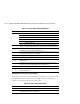
Checking Controller-to-Device Communications
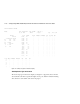
Use the VTDPY display device to see how or if the controller is communicating with the
devices in the subsystem (see Figure 4–2). This display contains three important regions:
■ Device map region (upper left)
■ Device status region (upper right)
■ Device-port status region (lower left)
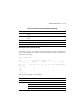
KB/S Average amount of data transferred to and from the unit during the last update
interval in 1000-byte increments.
Rd% Percentage of data transferred between the host and the unit that were read from
the unit.
Wr% Percentage of data transferred between the host and the unit that were written to
the unit.
CM% Percentage of data transferred between the host and the unit that were compared.
A compare operation can accompany a read or a write operation, so this column is
not the sum of columns Rd% and Wr%.
HT% Cache-hit percentage for data transferred between the host and the unit.
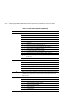
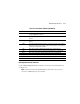
Table 4–9 VTDPY Default Display Columns (Continued)
Column Contents