
Operating instructions


Page 14
R.5-MAX, R2-MAX
Installation and Operation Manual
Now, as a thought experiment, imagine that we apply the specified maximum of 63 Volts to the entire loudspeaker before
applying the recommended +6 dB boost at 70 Hz. The entire bandwidth of the loudspeaker would then be operating at its
2000 watt limit. Now, add the +6 dB boost at 70 Hz into the signal chain. The flat portion of the driver pass band will still be
receiving 63V, but at 70 Hz the voltage will be 6 dB higher, or about 127V, which is the equivalent of about 8000 watts! Clearly,
the LF driver cannot handle 8000 watts continuously, so some compromise must be made.
To protect the LF driver from over excursion or thermal damage, we’ll need to limit the voltage at 70 Hz to the specified
maximum of 63V (2000 watts). Since we’ve boosted 70 Hz with the +6 dB PEQ filter, this is the only frequency that is able to
reach the full 2000 watt input. The remainder of the loudspeaker’s pass band will receive 6 dB less input voltage, or about
32V, which corresponds to only 500W. Figure 9 illustrates the situation.
Frequency (Hz)
‐36
‐30
‐24
‐18
‐12
‐6
0
6
12
18
10 100 1000
10 100 1000
-18
-6
0
-12
18
6
12
+6dB
+0dB
32V + 6dB = 63V (2000W)
applied to driver at 70 Hz
Non-boosted poron
of driver has only 32V
(500W) applied
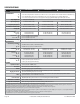
Figure 9. Generic DSP EQ transfer function with +6 dB @ 70 Hz boost
FREQUENCY RESPONSE (processed multi-amp*)
70
80
90
100
110
120
10 100 1000 10000
Amplitude(dBSPL)
Frequency(Hz)
FrequencyResponse(EQ3)
1/6OctaveSmoothing
Frequency (Hz)
— Complete, — High Frequency — Low Frequency 1/6 Octave Smoothing
100
1000
10000
10
70
80
90
100
110
120
Amplitude (dB SPL)
Figure 10. R2-64MAX Spec Sheet Frequency Response Graphs
70
80
90
100
110
120
10 100 1000 10000
Amplitude(dBSPL)
Frequency(Hz)
FrequencyResponse
HighFrequency LowFrequency
Resolution>180Hz~ 12Hz,<180Hz~3Hz, 1/6OctaveSmoothing,1
W
1/6 Octave Smoothing, 1W/1m
Frequency (Hz)
— High Frequency — Low Frequency
100
1000
10000
10
70
80
90
100
110
120
Amplitude (dB SPL)
FREQUENCY RESPONSE (unprocessed)
LOW FREQUENCY “BOOST” EFFECT (continued)
With any loudspeaker, for every 3 dB of LF boost, the resultant maximum amount of power available to the flat portion of
the pass band is cut in half. And, 6 dB of boost results in one quarter of the original power. For our example loudspeaker, this
means the Maximum Output SPL in the flat portion of the pass band is reduced from 130 dB down to 124 dB.
Most manufacturers’ spec sheets do not discuss the EQ transfer function used to create the frequency response curve
and they may not disclose the LF boost that has been applied. This makes it dicult or impossible to determine the actual
Maximum Output SPL with EQ. Sometimes, the spec sheet will show “unprocessed” and “processed” response curves. These
provide some indication of the LF boost. However, it is still time consuming to calculate the actual LF boost and its eect on
Maximum Output SPL. Complicating matters further, acoustic simulation and coverage prediction software does not usually
account for the dierences in real-world output that occur as the result of this LF boost, even when the EQ filters are included
in the loudspeaker source file. Modern acoustic simulation software predicts loudspeaker system results so well that many
users may not realize they have overlooked the eect of EQ boost until the system has been installed and it either cannot
reach the intended output levels, or the LF extension must be reduced in order to achieve the output levels.
COMMUNITY’S ALTERNATE APPROACH
As a contrast to the competitive loudspeaker in our thought experiment, Figure 10 shows the published response curves,
with notation, for Community’s R2-64MAX.
Note the asterisk after “(processed multi-amp*)”. This refers the reader to the explanation you are now reading. These R-MAX
curves include LF boost to produce the result shown in the frequency response chart. However, other manufacturers may
use much greater boost (in excess of 6 dB) to achieve their published results.