
System information


credentials, IP address settings, port number, and the method
used.
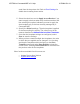
VQM is an optional section of the Summary menu. Not all devices
have voice quality monitoring (VQM) statistics. If available, VQM
statistics are provided in a summary graph at the bottom of the
screen displaying the MOS LQ and Call Quality. The data can be
filtered to show only a specific interface or to show a summary of
all calls. To change the filter, select the down arrow in the upper
right portion of the VQM summary section. The menu that appears
lists the available interfaces and also the Summary option. Select
one of the options from the list.
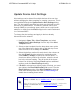
The time frames shown cover three different intervals: 1 hour, 12
hours, and 1 day. More details are provided for each interval in a
tool tip by moving the mouse over the bar on the graph. For the
MOS LQ graph, the pop-up window displays the number of calls
and the latency queueing (LQ) average. For the Call Quality
graph, the tool tip displays the number of calls and the quality
represented by each color bar. For instance, green shows
Excellent call quality and blue shows Good call quality. To review
the data in greater detail, double click a bar in the graph. This
brings up the detailed VQM Statistics menu, filtering the data
based on the bar graph selected. If the bar graph you selected
displayed only VLAN 2 calls, then the resulting VQM Statistics
graph shows only data for calls on VLAN 2 calls. Refer to VQM
Statistics Menu for more information.
ADTRAN n-Command MSP v6.1 Help
61700841G1-1A