A dummy’s guide to image analysis used in the comet assay Barbara Vilhar University of Ljubljana Biotechnical Faculty Department of Biology
Help! There is a comet in my computer! i Contents Do you have a problem?...................................................................................... 1 1 Fluorescence microscopy............................................................................. 3 2 Detection of emitted light .............................................................................. 7 3 Measurement of the comet parameters ....................................................... 9 3.1 Grey values ...............
Help! There is a comet in my computer! ii Figures Figure 1. The principle of fluorescence and absorption and emission spectra of DNAbound ethidium bromide................................................................................................... 4 Figure 2. The path of light through a microscope during observation of fluorescence of ethidium bromide .............................................................................................................. 6 Figure 3.
Help! There is a comet in my computer! 1 Do you have a problem? Here I will talk about the basic principles of image analysis used in the comet assay. This should help you spot and solve potential problems in your measurements, avoid measurement errors, understand the settings available in software packages and the language used in user manuals, and improve your communication with the software companies when you run into trouble.
Help! There is a comet in my computer! 2 An annoying problem with computers is that, unless they crash, they will always give you a result. The above story is true, but it is not about the comet assay. Nevertheless, it is about measurement of the amount of DNA in nuclei on a microscope slide (to determine genome size in different organisms). I have to admit here that I have never prepared one single microscope slide for the comet assay.
Help! There is a comet in my computer! 3 1 Fluorescence microscopy We are running a comet experiment. We prepared the slides and ran electrophoresis. Now we have to measure the amount of DNA that migrated out of nuclei. The most important thing to remember is this: Measurement is based on a known relationship (e.g. linear, logarithmic) between the amount of DNA in the sample and the parameter used for detection of DNA.
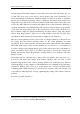
high energy 500 600 EB excitation (energy absorbed) EB emmision (energy released) low energy on ot low energy ph 700 Energy Wavelength of light (nm) 400 ph ot on A 4 high energy Help! There is a comet in my computer! emission filter B Absorption and Emission (a.u.) excitation filter 100 DNA/EtBr absorption 80 DNA/EtBr emission 60 40 20 0 400 500 600 700 Wavelength (nm) Figure 1. The principle of fluorescence and absorption and emission spectra of DNA-bound ethidium bromide.
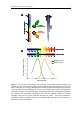
Help! There is a comet in my computer! 5 When a slide is illuminated with green light, DNA-bound ethidium bromide on the slide emits orange light in all directions (Figures 2B, 2C). During observation of an object through eyepieces of a microscope, we see only light that is collected by the objective. We now have two problems: the emitted light is very weak and some of the strong excitation green light is reflected from the slide.
Help! There is a comet in my computer! A 6 camera mirror excitation filter eyepiece source of excitation light for fluorescence (e.g. mercury lamp) objective microscope slide source of white light (e.g. halogen lamp) filtering of excitation light B mirror C emission filter detection of emitted light through eyepieces detection of emitted light with a camera Figure 2. The path of light through a microscope during observation of fluorescence of ethidium bromide.
Help! There is a comet in my computer! 7 2 Detection of emitted light Our eyes, supported by our brain, are amazing instruments. We process incredible amounts of visual information and store a lot of what we see in our memory. We can see very small details. We can focus to near and far objects. There is one problem with our eyes, though – we are not very good at judging the quantitative aspects of all the information we receive.
Help! There is a comet in my computer! 8 A B C Figure 3. Light emitted from a comet on a slide is detected as an image. An image of a real comet on a microscope slide is shown in A. A simplified model image of the comet (B) will be used to demonstrate measurement of the comet parameters. An image is composed of separate pixels (C). The size of this model image of the comet is 35 pixels × 25 pixels. Images that cameras record have many pixels (e.g.
Help! There is a comet in my computer! 9 3 Measurement of the comet parameters Now we recorded an image, and finally we come to image analysis. Many software packages can display the information they receive from a camera on the screen and save image files, but this is not image analysis. The (relatively vague) definition states that image analysis is a tool for extraction of quantitative (!) information contained in an image.
Help! There is a comet in my computer! 10 250 A C Grey values 200 B 240 221 221 41 41 221 41 46 41 150 100 50 0 Amount of DNA Intensity of emitted light Figure 4. Information on an image is coded as grey values. An image of a comet is composed of separate pixels (A), where each pixel has a grey value, as shown in B for the small image area outlined in red in A. The model image is an 8-bit image with available grey values 0-255.
Help! There is a comet in my computer! 11 A B head tail head tail Figure 5. Segmentation of the comet image. During segmentation, the regions of interest (ROI) for measurement of the comet parameters (the head and the tail) are defined. The user can interactively draw rectangles that define the head and the tail ROI (A; box segmentation). In some software packages, the head and the tail are detected (semi-)automatically and outlined (B; closefitting segmentation). 3.
Help! There is a comet in my computer! 12 200 µm = 375 pixels Figure 6. Geometric calibration of the image analysis system. We record an image of a micrometer ruler under a microscope with a camera and then measure the distance between the micrometer markings on the recorded image. In this case, the scaling factor is 200µm / 375 pixels = 0.53 µm per pixel. Note that the objective magnification is not the only parameter that affects the scaling of images.
Help! There is a comet in my computer! 13 3.4.1 And I measured my comet at 400× magnification... While we are talking about lengths, scaling factors and related topics, let us discuss a common misconception about “magnification”. We recorded an image of a comet and now we want to publish it. For publication, we need to quote the scaling of the image. Let us say that we observed the comets under the microscope, using a 40× objective and 10× eyepieces.
Help! There is a comet in my computer! 14 3.5 Measurement of light intensity parameters Several parameters measured in the comet assay describe the intensity of light emitted from the comet slide – they are called the light intensity parameters. Their measurement is based on information contained in the grey values of an image and they describe the quantity and distribution of DNA in a comet. The very good news is that we only need to measure the relative amount of DNA (e.g.
Help! There is a comet in my computer! 15 intensity from the total light intensity that we recorded. If we do not do this, we will compromise the linear relationship between the amount of DNA on the slide and the grey values on the image.
Help! There is a comet in my computer! 16 Table 1. Subtraction of the background signal for each pixel column of the comet on the model comet image. The data are for box segmentation (see Figure 8 for grey values of individual pixels). The pixel column number eight, which is used as an example in the text, is shown in blue numbers. The background-corrected comet intensity is used for all further calculations.
Help! There is a comet in my computer! 17 However, we will now not average the grey values for the whole background region – we will instead calculate the average background grey value for each column of pixels separately. Why we need to do it this way will become clear later – it is to minimise the measurement error (see chapter Shading, page 35). Let us take the pixel column number eight (outlined in dark blue in Figure 8) as an example.
Help! There is a comet in my computer! 18 3.5.4 Comet profile We have now done all the necessary things to tackle a new task – the comet profile of light intensities. An example of a comet profile is shown in Figure 9. How does the computer calculate and draw the profile? Recorded comet intensity Background-corrected comet intensity Scaled background intensity Figure 9. The comet profile for a comet recorded from a microscope slide.
Help! There is a comet in my computer! 19 Figure 10. The comet profile of the model comet image. Box-segmentation (A): The recorded comet intensity is the intensity on the original (grabbed) image. The scaled background intensity is the mean intensity in the background region (4 pixels) scaled to the height of the comet ROI (11 pixels; the scaled background intensity from Table 1). The background-corrected intensity is the recorded intensity minus the scaled background.
Help! There is a comet in my computer! 20 Let us look at our model comet image (Figure 11). First, we will determine the position of the intensity centroid of the tail. The centroid is the x-coordinate at which half of the total intensity of the tail is to the left and half to the right of this coordinate (half of “grey value weight” to each side of the coordinate).
Help! There is a comet in my computer! 21 4 Recorded image and displayed image We assumed at the beginning of our calculation of comet parameters that we recorded an image of a comet with a camera. We worked with the pixel grey values of the original recorded image that are stored in the image file. However, when we are measuring comets, we have no direct access to the grey value data – instead of the numbers, the computer shows us an image on the screen.
Help! There is a comet in my computer! 22 B: increased contrast C: decreased contrast A: no change B: increased contrast C: decreased contrast grabbed image (file) displayed image (screen) grabbed image (file) displayed image (screen) A: no change Figure 12. The grabbed and the displayed image. Changing the settings of the displayed image that we see on the screen (top row) does not affect the grabbed image, stored as an array (table) of grey values (numbers) in the computer memory (bottom row).
Help! There is a comet in my computer! 23 Images of orange comets on a black background (Figure 13C) are very popular. Notably, most systems for comet measurement use monochrome cameras (called “black-and white” cameras in ordinary life) that only detect the intensity of light, but not colour (wavelength). Monochrome cameras can thus only record greyscale images, not colour images.
Help! There is a comet in my computer! 24 same illusion of continuous motion as we have when watching movies, which are also composed of separate images. When we click to record an image, we say that the image is grabbed or acquired. Unlike the live image, the grabbed image is saved in more permanent memory of the computer for later use in image analysis and measurements.
Help! There is a comet in my computer! 25 Figure 14. Look-up tables (LUTs). A LUT contains instructions for translation of the grey values on the grabbed image recorded by a camera (A) to the displayed image on the screen (B-F). If a LUT translates each grabbed grey value to the same displayed grey value, we see on the screen the actual grabbed image (B). A LUT is also used to construct a negative (inverted) greyscale image (C).
Help! There is a comet in my computer! 26 5 Image acquisition The first rule of image analysis states that all care should be taken to record images of the highest quality possible. Information that is not contained in the grabbed (recorded) image cannot be restored later, no matter how we change and process our image. An image analysis system has many settings that affect the properties (quality) of the grabbed image.
Help! There is a comet in my computer! 27 5.1 Histogram of image grey values Number of pixels It is, however, not important at all for our measurement whether the image “looks” fine to us. The only important thing is what the computer can distinguish in it.
Help! There is a comet in my computer! 28 The two basic properties of an image, related to the range of grey values that are used to store information, are image contrast and brightness. Image contrast is the difference between the highest (brightest) and the lowest (darkest) grey value in an image. Image brightness describes whether the range of grey values used in the image is in the darker part of the greyscale (at low grey values) or in the brighter part of the greyscale (at high grey values).
Help! There is a comet in my computer! 29 Figure 17. Image contrast and brightness. Images of the same comet are shown in A, B and C. The grabbed images are shown as greyscale images (GV) and displayed also using an orangescale LUT (shown at the bottom). Image A has a high contrast (grey values 14 - 198, contrast range 185). Image B has a lower contrast (grey values 6 – 85, contrast range 80). Image C has the same contrast range as image B (80, grey values 82 - 161).
Help! There is a comet in my computer! 30 5.3 Image saturation The recorded image is not suitable for measurement of the comet parameters if is either overexposed or underexposed or both (Figure 18). This means that some pixels in the image have the minimum grey value (0) or the maximum grey value (255); we say that these pixels are saturated. Consequently, an image that contains saturated pixels is also saturated.
Help! There is a comet in my computer! 31 they violate the linear relationship between the amount of DNA on the slide and the recorded grey values. Figure 18. Image saturation. Images of the same comet are shown in A, B and C. The grabbed images are shown as greyscale images (GV) and displayed also using two LUTs (shown at the bottom).
Help! There is a comet in my computer! 32 Some comet software packages feature an option to set the maximum number of allowed saturated pixels. A very small number of saturated pixels does not severely affect the measurement. In addition, some light-sensitive detector elements in the camera may not function properly; they may not be able to detect the signal or may misfire when there is no light. Even a new camera may have some dysfunctional pixels.
Help! There is a comet in my computer! 33 white regions, and those regions of the image that have the grey value lower than the grey value selected with the slider as black regions. Figure 19. Viewing image histograms and grey values in Photoshop. Image histogram is displayed using the “Levels” tool (A). Using the “Threshold” tool to analyse the grey value range used in the image is illustrated in B-D.
Help! There is a comet in my computer! 34 Let us now drag the slider from left to right for the image shown in Figure 19. At grey value 0, the whole image is black (no signal). At grey value 26, the first pixels appear as small white dots (Figure 19B) – the minimum grey value in our image is 26. At grey value 36, we can see the first pixels of our comet (Figure 19C), and at grey value 151 the whole comet (Figure 19D).
Help! There is a comet in my computer! 35 5.5 Shading Our measurement was based on the assumption that a linear relationship exists between the amount of DNA on the slide and the light intensity that the camera detected. One of the factors that can endanger this relationship is shading of the image. We talk about shading when there is a gradient in the intensity of the background signal across the image.
Help! There is a comet in my computer! 36 Uneven illumination of the field of view cannot be completely eliminated even in an optimally aligned microscope. Hence, it is good practice to place all measured comets in the same position on the image during image acquisition, close to the centre of the field of view, where shading is least severe in a well-aligned microscope. A weak shading effect is partially corrected during calculation of the comet parameters.
Help! There is a comet in my computer! 37 on the right side. In the image with severe shading (Figure 22D: 1-5), the background is clearly much brighter in the lower left part of the image than in the upper right part. Figure 22. Detection of image shading in Photoshop. Two cases are shown: an image with a low level of shading (A, B) and an image with severe shading (C, D). The analysed images are indicated with a red border.
Help! There is a comet in my computer! 38 5.7 Why a 10-bit camera beats an 8-bit camera In the comet assay, a camera serves as a detector of light intensity and hence its properties affect the quality of the measurement. There are many different types of cameras out there, and we will only cover some topics essential for understanding the comet measurement. We have video cameras and digital cameras, and both can be used for the comet assay.
Help! There is a comet in my computer! 39 Figure 23. Comparison of an 8-bit and a 10-bit camera. While an 8-bit image has 256 available grey values (A, B), a 10-bit image has 1024 available grey values (C,D). Hence, a 10-bit image that contains the same amount of information as an 8-bit image uses a small range of all available grey values (C).
Help! There is a comet in my computer! 40 Having a higher pixel depth brings another advantage. When we start recording images for a comet experiment, we optimise the system to acquire images of good quality. We should also not change the settings of image acquisition during recording of one experiment. The problem is that when we are adjusting the settings of the system, we only see a few comets. We do not know whether on other slides we will have comets with much brighter heads than the ones we see.
Help! There is a comet in my computer! 41 the signal at a high enough resolution to allow for reliable measurement of the comet profile. The optimal setting of binning for recording of comets depends on the properties of the equipment for comet measurement (the full resolution of the camera, the magnification of the objective etc.) and on the size of scored nuclei and comets (smaller comets require a higher resolution of the image, weaker comets require higher sensitivity).
Help! There is a comet in my computer! 42 after we mark the comet borders, we return the image back to original prior to measurement. How can we find out how our software actually works? Possibly this is described in the user manual. We can also record a good image of a comet, save it and then import it to the comet software and try to measure this same image several times using drastic changes of the displayed image (e.g. very overexposed, very underexposed).
Help! There is a comet in my computer! 43 Figure 25. Different versions of user interface for adjusting the camera settings. The main settings are contrast / brightness, offset / gain, exposure time, binning. When we are adjusting the camera and we have no image histogram available, we need to make sure that the image that we see displayed on the screen is a replica of the grabbed image and not changed by any display settings.
Help! There is a comet in my computer! 44 Figure 26. Examples of contrast and brightness settings of the displayed image. For adjustment of the camera settings, the contrast and brightness settings of the displayed image have to be set to neutral, so that the actual grey values of the grabbed image are displayed. In example A, the neutral settings of the displayed are brightness –0.5 and contrast 1.0 (and gamma correction factor of the displayed image 1.0).
Help! There is a comet in my computer! 45 6 Concluding remarks I said “linear relationship” so many times that I would really like to avoid it in my concluding remarks. But, here it comes again, because there really is only one rule for measurement of comet parameters: Do not violate the linear relationship between the amount of DNA and the grey values on the image of a comet (Figure 27).
Help! There is a comet in my computer! 46 Notes I learned about image analysis and the comet world from many people, and I feel indebted to them all. In particular, I wish to thank Dr Aleš Kladnik for inspired image analysis debates and for helping me survive computer crashes. Janja Plazar and Irena Žnidar drew my attention to various “comet mysteries”. Janja Plazar also recorded the image of a comet used as an example throughout this work. Adobe Photoshop is a trademark of Adobe Systems Inc.