
Operator`s manual

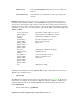


LST 18:00:00 /select a time when CasA is at higher elevation
: record filename /Start recording, filename is optional
: azel 80 45 /Calibration position
: freq 1419 20 0 /Set frequency, number of samples and sample
spacing
: 1419.0 /Center frequency with 500MHz bandwidth
(default)
: calibrate
: noisecal /When calibrating with noise diode
: CasA /Move to CasA
:300 b /300 seconds observing, b=beamswitch mode
: roff /recording off
Discussion of Data Reduction:
The resulting data output file will be a succession of on-source then off-source
samples. The statistical reduction to arrive at an average Antenna Temperature
T
ant
to use in the above Aperture Efficiency equation is as follows:
P
k
= P
on
- P
off
Where, k = the cycle number. (On/Off pair)
For, k = 0,2,4 -p
off
+ previous P
on
For, k = 1,3,5 P
on
- previous P
off
For N cycles
P
ave
= Σ P
k
/ N
Where, P
ave
= average of N on/off pairs
P
SD
= (ΣP
k
2
- N P
ave
2
)
1/2
(N - 1)
-1/2
For N>1
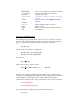
The plot of the reduced output data was generated from a program written by
Alan Rogers for SRT Beam-Switched Data reduction. The program is written in
JAVA and when compiled will read the output data file from the SRT
beamswitched run. The syntax of the compile and run steps are listed as follows:
C:\ javac bplot.java
C:\ java bplot filename.rad
The output data plot is in Postscript form with the default name:
C:\ srt.pos